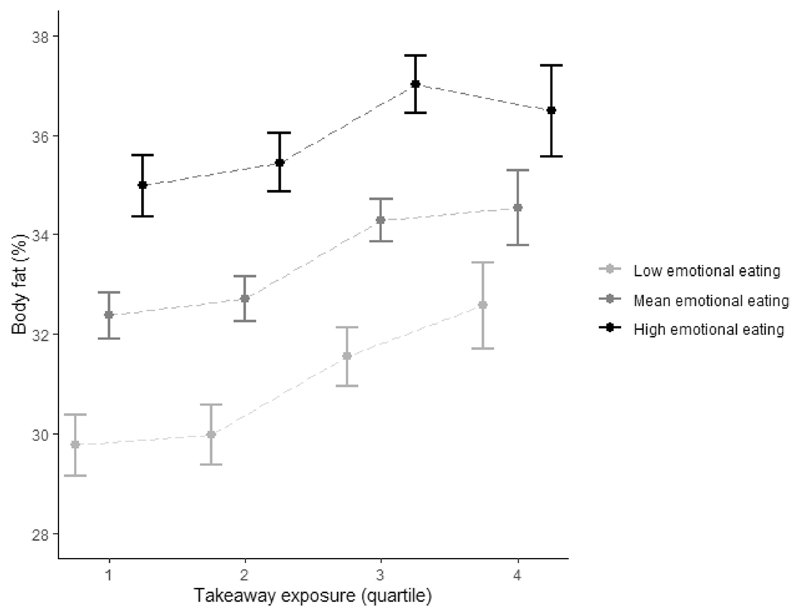
Figure 4.
Mean and 95% CI body fat percentage per quartile of takeaway outlet exposure in the Fenland Study (n=4791) stratified by emotional eating (low = 1SD – mean, high = 1SD + mean) adjusted for age, sex, household income, occupation, age at highest educational qualification and counts of supermarkets in home neighbourhoods

