Figure 3.
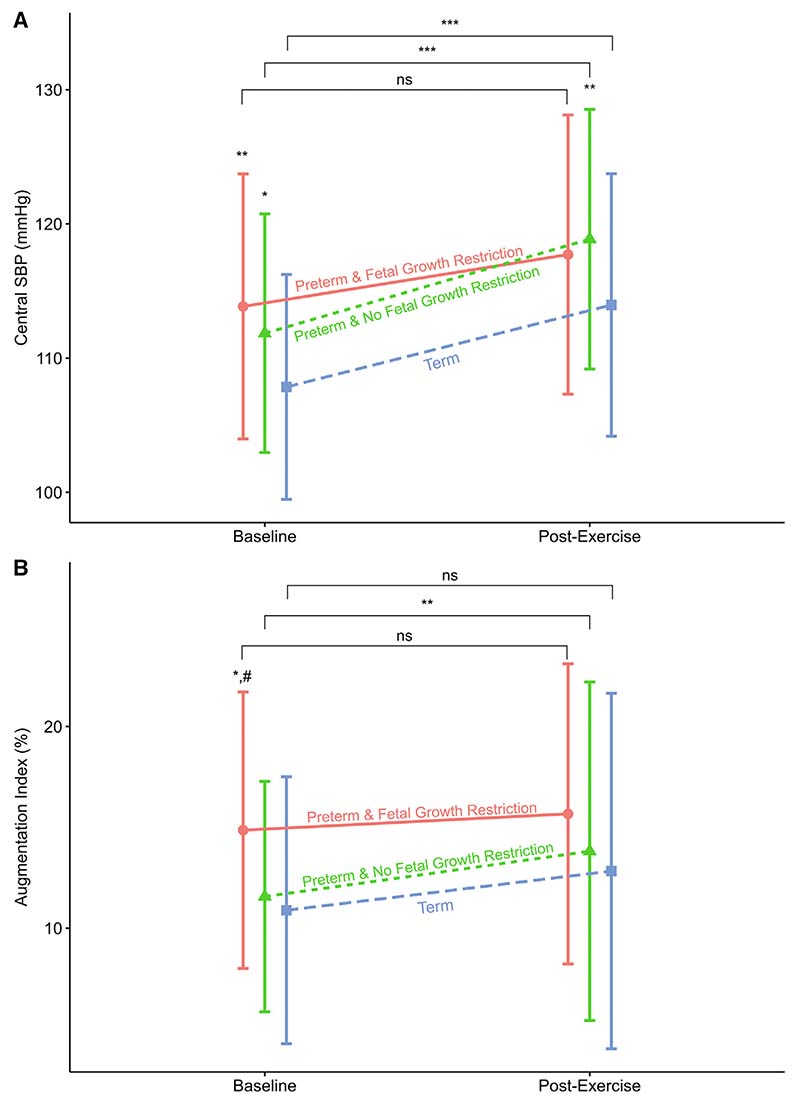
A, Central SBP and B, augmentation index by group at baseline and after cardiopulmonary exercise testing (n = 179). Groups labelled with text and shapes (Circle = Preterm and fetal growth restriction, Triangle = Preterm & No fetal growth restriction, Square = Term). Shape also represent respective group mean, SD given by vertical bars. At baseline and post cardiopulmonary exercise testing time points *P < .05 compared with term, **P < .01 compared with term, #P < .05 compared with preterm AGA. At baseline, for central SBP both preterm-born groups had significantly higher measurements than term-born. Preterm-born fetal growth restriction group significantly higher augmentation index than preterm-born AGA and term-born children. Post cardiopulmonary exercise testing Preterm-born AGA had significantly higher SBP than term-born. No differences seen in augmentation index post cardiopulmonary exercise testing. Horizontal brackets compare baseline with post cardio-pulmonary exercise testing: *P < .05, **P < .01, ***P < .001. Preterm-born AGA and Term-born showed significant increase in their respective mean SBP between baseline and post cardiopulmonary exercise testing. Only Preterm-born AGA showed a significant increase in augmentation index between baseline and post cardiopulmonary exercise testing.

