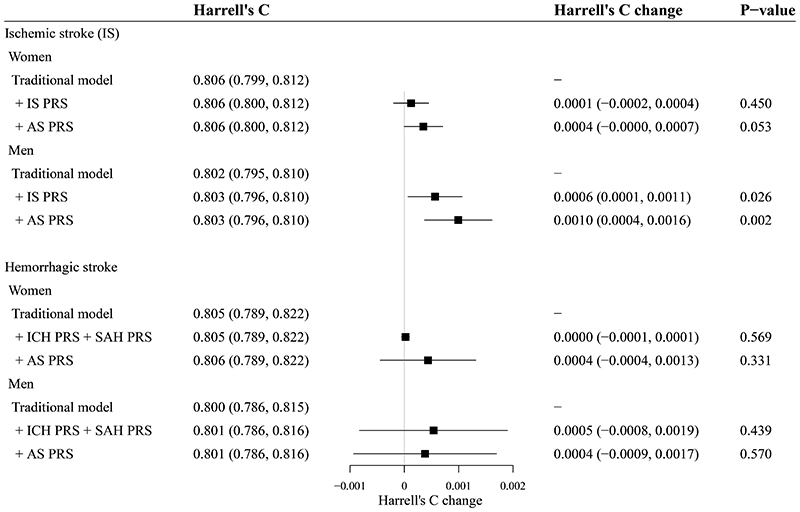
Figure 3. C statistics evaluating the performance of PRS.
CIs: Confidence intervals; CKB: China Kadoorie Biobank; CVD: Cardiovascular disease; ICD: International Classification of Disease; PRS: Polygenic risk score.
The traditional risk prediction models (traditional models) were defined as sex-specific Cox models stratified by 10 study regions, with time on study as the time scale, including models for ischemic stroke (ICD-10: I63) and models for hemorrhagic stroke (ICD-10: I60-I62).[18] Predictors included in traditional models were the same as the “CKB-CVD models”, including age, systolic and diastolic blood pressure, use of anti-hypertensives, current daily smoking, self-reported diabetes, and waist circumference. Interactions between age and the other six predictors were also included. The 95% CIs of Harrell’s C and Harrell’s C changes were calculated by 100 bootstrap replications using the BCa method in Stata.

