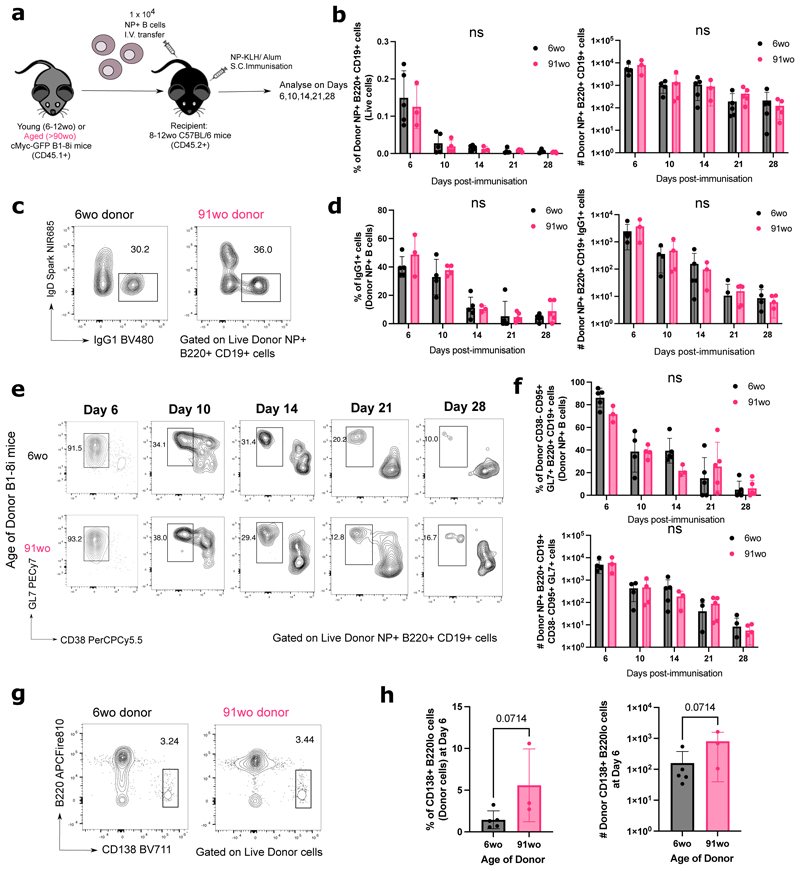
Figure 2. B cells from aged donor mice have no defects in class-switch recombination, entering the GC response and plasmablast differentiation.
(a) Schematic diagram of adoptive transfer experiments to compare the response of B cells from young (6-12wo) and aged (>90wo) mice in young recipient mice post-immunisation with NP-KLH in alum. Draining inguinal lymph nodes (iLNs) were taken at indicated times post-immunisation for downstream analyses. (b) Graphs depicting the percentage and number of donor NP+ B220+ CD19+ cells out of live cells in recipient iLNs at different timepoints post-transfer and immunisation. (c-f) Representative flow cytometric plots showing gating strategies for donor-derived IgG1+ IgD- B cells (c) and CD38- GL7+ GC B cells (e) from 6wo or 91wo donor mice at different timepoints post-transfer and immunisation. Numbers adjacent to gates indicate percentage of donor NP+ B220+ CD19+ cells. Graphs depicting the percentage and number of donor NP+ IgG1+ cells (d) and donor NP+ CD38- CD95+ GL7+ cells (f) in recipient iLNs at different timepoints post-transfer and immunisation. Statistics were calculated using 2-way ANOVA with Sidak’s multiple comparisons test. (g) Representative flow cytometric plots showing gating strategies for donor-derived CD138+ B220lo cells from 6wo or 91wo donor mice at day 6 post-transfer and immunisation. Numbers adjacent to gates indicate percentage of donor cells. (h) Graphs depicting the percentage and number of donor CD138+ B220lo cells in recipient iLNs at day 6 post-transfer and immunisation. Bar height corresponds to the mean, error bars indicate standard deviation, and each symbol represents values from individual recipient mice. Statistics were calculated using unpaired Mann-Whitney U test. Data representative of two independent repeat experiments.

