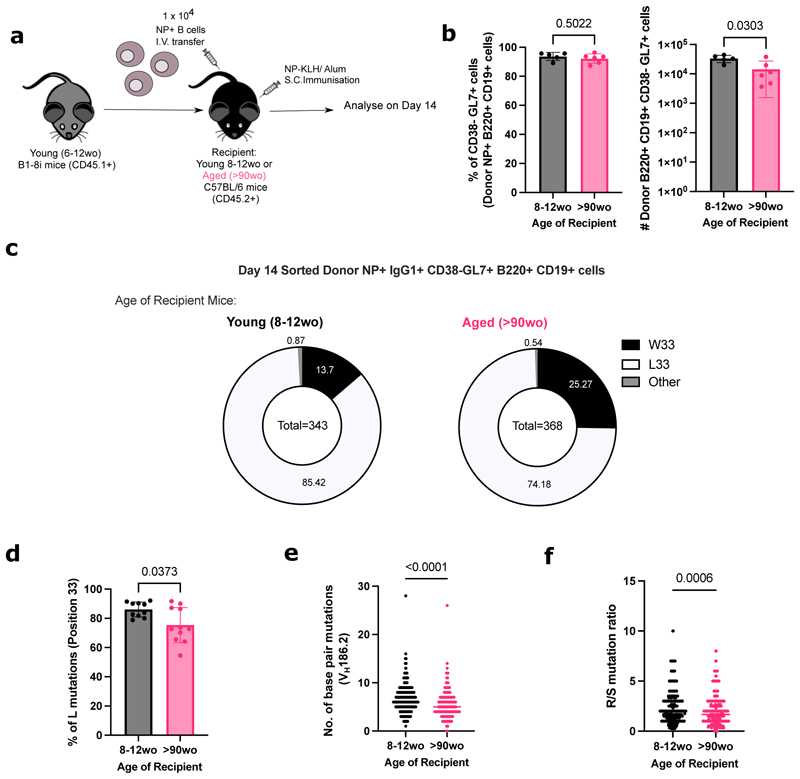
Figure 5. NP-specific B cells from young mice have defects in affinity maturation when transferred into aged recipient mice.
(a) Schematic diagram of adoptive transfer experiments to compare response of B cells from young (6-12wo) B1-8i mice in young (8-12wo) or aged (>90wo) recipient mice post-immunisation with NP-KLH in alum. Draining inguinal lymph nodes (iLNs) were taken at day 14 post-immunisation for downstream analyses. (b) Graphs depicting the percentage and number of donor NP+ CD38- CD95+ GL7+ GC B cells in recipient iLNs at day 14 post-transfer and immunisation. (c) Pie charts indicating the frequency of the affinity-inducing mutation W33L in the CDR1 region of VH186.2 sequenced from single cell sorted NP+ IgG1+ CD38- GL7+ B220+ CD19+ cells from young adult B1-8i mice in recipient iLNs 14 days post-immunisation. The values in the centre of the pie charts indicate the total number of cells sequenced per group (n=10-11 mice per group from two independent experiments, with an average of 35 GC B cells sequenced per mouse). The number of sequences analysed per recipient mouse is shown in Supplementary Figure 3b. (d) Graph depicting the percentage of sorted GC B cells from young adult B1-8i mice with the W33L mutation in young or aged recipients. Bar height corresponds to the mean, error bars indicate standard deviation, and each symbol represents values from individual recipient mice. (e-f) Graphs depicting the number of single base pair mutations (e) and the ratio of replacement: silent mutations (f) in the CDR1 region of VH186.2 among sorted donor-derived GC B cells in young or aged recipients at day 14 post-immunisation. Each symbol represents values from a single sorted GC B cell. Statistics were calculated using unpaired Mann-Whitney U test. Data pooled from two independent repeat experiments.

