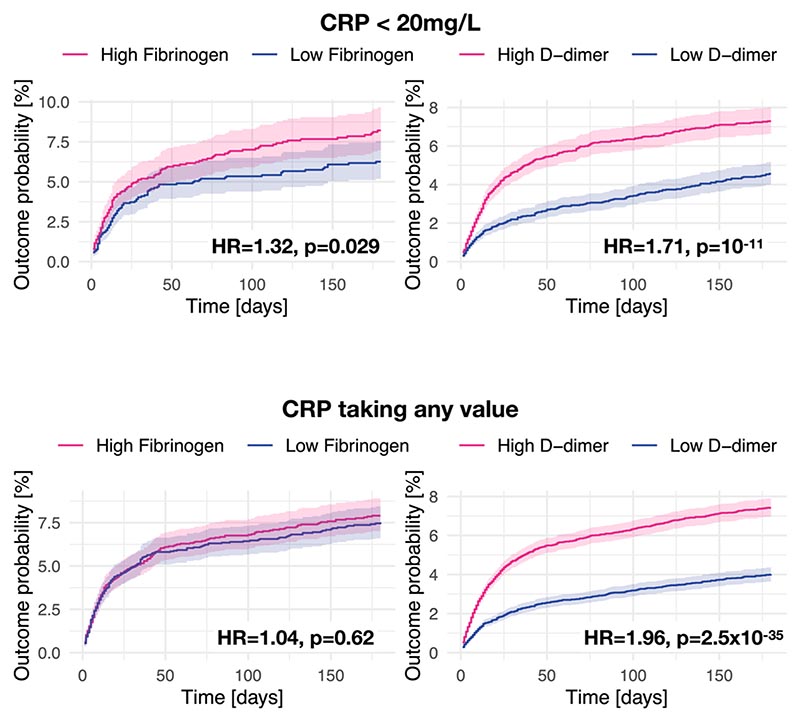
Extended Data Fig. 5. Associations between biomarkers and post-acute cognitive deficits in the EHR data with different constraints on CRP.
Kaplan– Meier curves represent the cumulative incidence of cognitive deficits between those with high versus low fibrinogen (or D-dimer) and CRP level ≤ 20 mg/L (top panels), or any CRP level (bottom panels). Curves represent the Kaplan– Meier estimates and shading around curves represents 95% confidence intervals. P-values are derived from log-rank tests, two-sided, and not adjusted for multiple comparisons.

