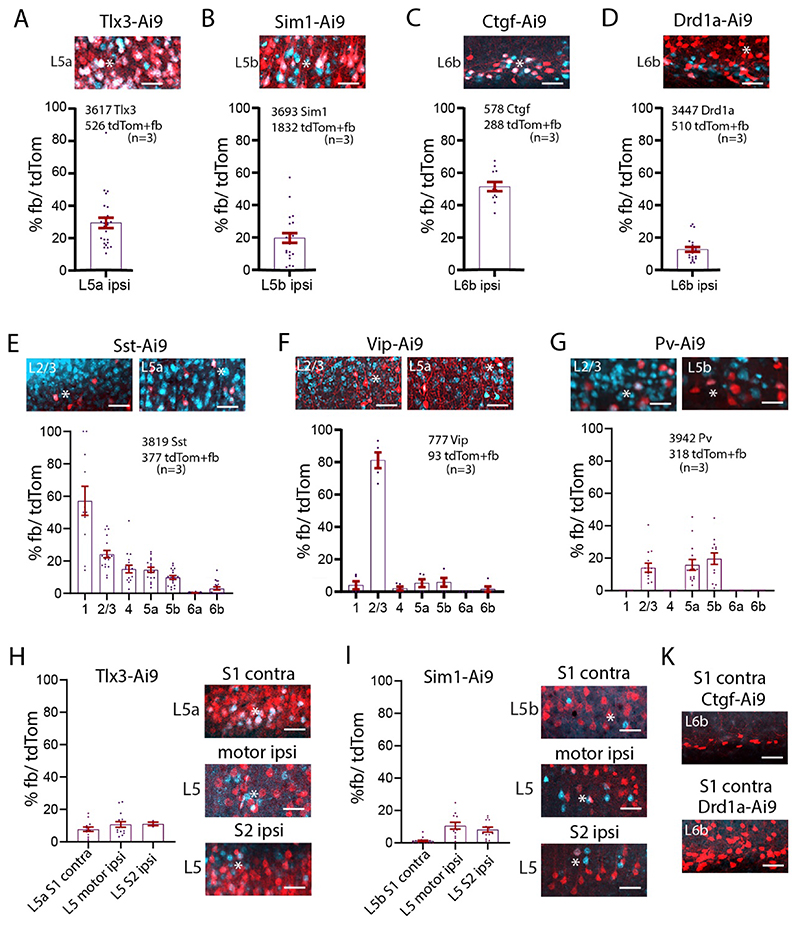
Figure 4. Local and long-range input from classes of L5 and L6b, and inhibitory cells to L1.
(A-G) Example images of fb uptake in Tlx3-Cre, Sim1-Cre, Ctgf-Cre, Drd1a-Cre, Sst-Cre, Vip-Cre, and Pv-Cre brains. Ipsilaterally, 29% of Tlx3 S1 project to L1. 20% of Sim1 neurons project to L1. 52% of L6b Ctgf positive neurons project to L1. Only 13% of L6b Drd1a neurons project to L1. Sst and Vip neurons in all layers take up fb on the ipsilateral side. More than 80% of L2/3 Vip neurons take up fb. Pv neurons take up fb in layers 2/3 and 5. (H) Example images of long-range fb uptake in Tlx3-Cre brain. Contralaterally, 8% of Tlx3 neurons in S1 project to L1. Tlx3 neurons in motor and S2 cortices also project to L1. Quantification shown in graphs. (I) Example images of long-range fb uptake in Sim1-Cre mice. Contralaterally, few Sim1 neurons in S1 project to L1. Sim1 neurons in motor cortices and S2 cortices also project to L1. Quantification shown in graphs. (K) No Ctgf or Drd1 neurons contralaterally of S1 project to L1. Each dot in the graphs represents one brain section. Total number of neurons counted in each mouse line and mice used (in brackets) are shown in each panel, analysis details in Tables 2C, 2D. Fast blue pseudo colored in cyan. Scale bars 50 μm.

