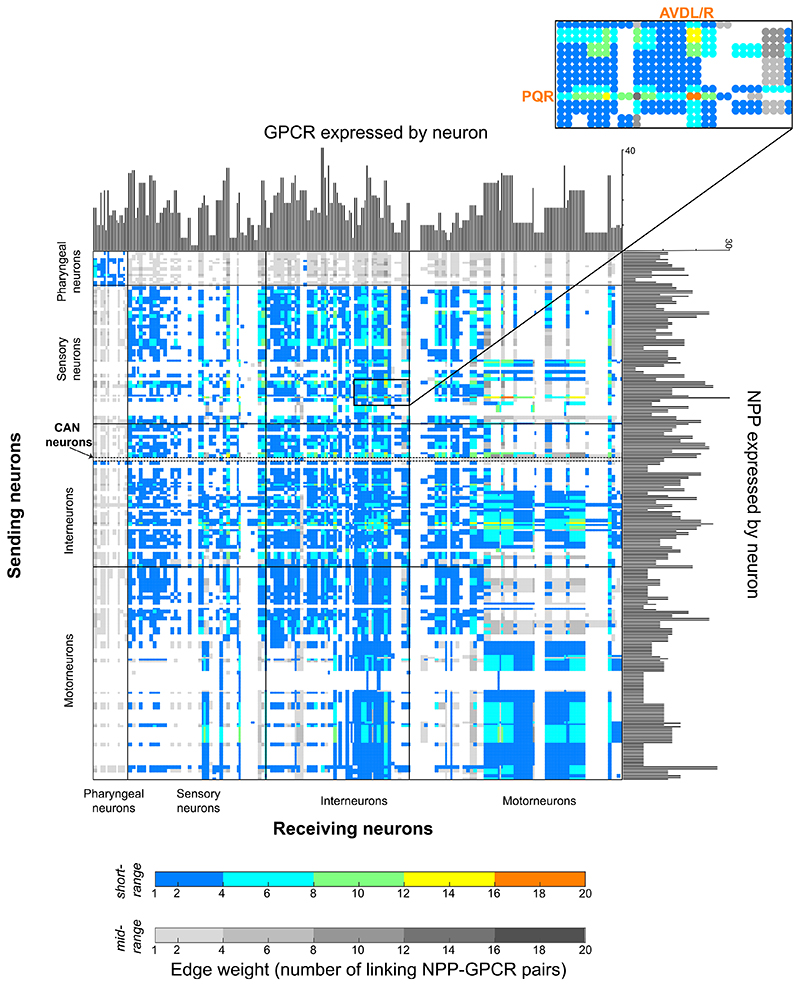
Figure 5. The aggregate neuropeptide connectome connects all neurons in a dense network.
Shown is the adjacency matrix of the aggregate network using short-range (color) and mid-range (gray) diffusion models. Histograms on the axes represent numbers of NPP and GPCR genes per neuron. Edge weights (range: 1–18) indicate the number of different NPP-GPCR pathways connecting a neuron pair in a given direction. 5% of all connections are putative autocrine connections.

