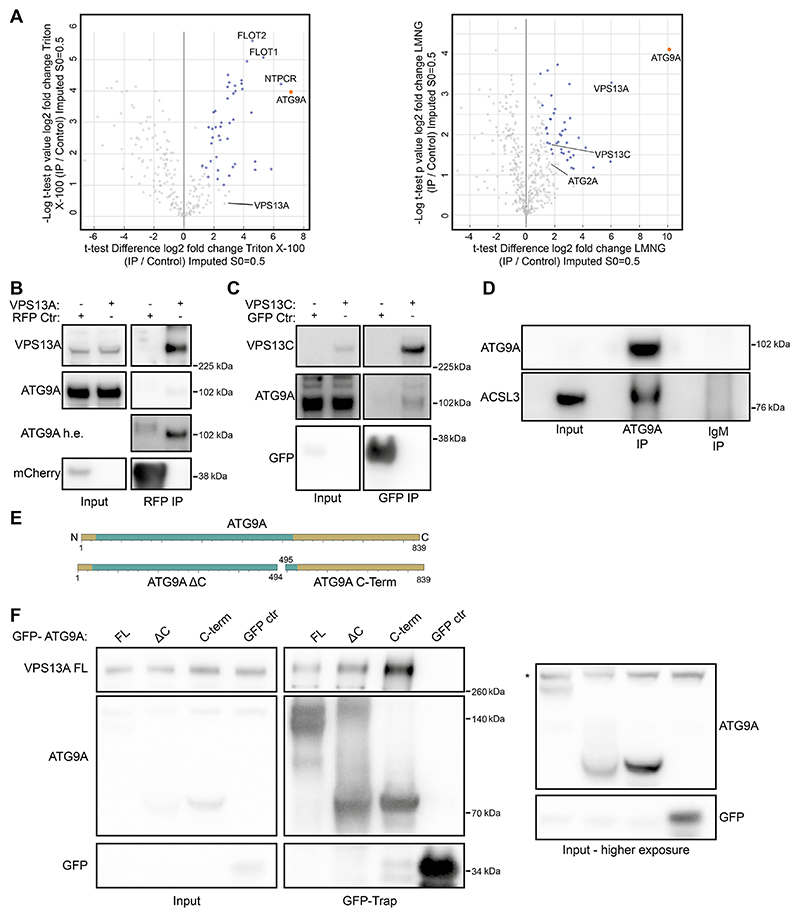
Fig. 1. Identification of new ATG9A-interacting proteins.
(A) Volcano plots of protein hits uncovered through mass spectrometry analysis by immunoprecipitating ATG9A after Triton X-100 or LMNG solubilization. The orange datapoint is ATG9A. Datapoints in blue are significantly enriched proteins as determined by an unpaired two-tailed t-test. Flotilin-1 (FLOT1), flotilin-2 (FLOT2), cancer-related nucleoside-triphosphatase (NTPCR), vacuolar protein sorting 13 homolog A and C (VPS13A and VPS13C) and ATG2A are indicated. (B) Immunoblot showing co-IP from cells of endogenous ATG9A using VPS13AμmCherry (tagged internally to preserve function). 1.25% of total lysate was loaded as input. The ATG9A h.e. blot shows the same ATG9A blot but with higher exposure. (C) Immunoblot showing co-IP from cells of endogenous ATG9A using VPS13CμClover (tagged internally to preserve function). 1.25% of total lysate was loaded as input. (D) Immunoblot showing co-IP from cells of endogenous ACSL3 using anti-ATG9A antibodies. 1.25% of total lysate was loaded as input. (E) Scheme of ATG9A fragments used in F. Green depicts the N-terminal core domain, gold the rest of the protein sequence. (F) Immunoblot showing co-IP from cells expressing 3×Flag−VPS13A full length (FL) with GFP−ATG9A FL, ΔC or C-Term. 1.25% of total lysate was loaded as input. The asterisk (*) denotes a non-specific band. Results shown in this figure are representative of three repeats.

