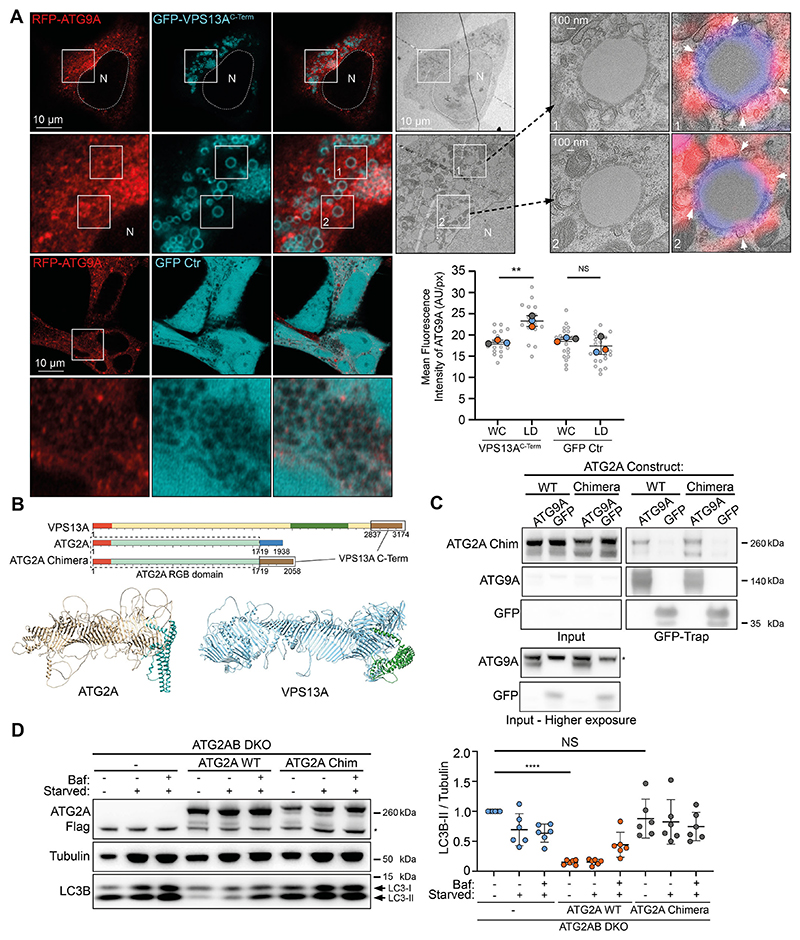
Fig. 3. Functional analysis of the ATG9A−VPS13A interaction.
(A) CLEM imaging of oleic acid-fed HEK293A cells expressing RFP−ATG9A (red) and GFP−VPS13AC-Term (cyan). A low magnification TEM image of a fluorescently imaged cell is shown. Insets numbered 1 and 2 show high magnification images. White arrowheads depict locations where the limiting membrane of a lipid droplet makes close contact with RFP−ATG9A positive membranes. Each large datapoint in the graph depicts the average mean fluorescence intensity of RFP−ATG9A per region (WC, whole cell; LD, lipid droplets), and represents an independent experiment (n=3), with smaller grey datapoints representing all the technical replicates (AU, arbitrary units). The mean±s.d. is also indicated. **P<0.01; NS, not significant (one-way ANOVA with Dunnett’s multiple comparisons test). (B) Scheme of VPS13A and ATG2A. Orange depicts the chorein N domains and forest green the VAB domain. Brown depicts the VPS13A C-terminal domain (encompassing PH and ATG_C domains). Blue depicts the ATG2A C-terminal domain (encompassing CLR and ATG_C domains). The RGB domain of ATG2A is teal. Chimera ATG2A is composed of the RGB domain of ATG2A (sequence 1−1719) and the C-terminus of VPS13A (sequence 2837−3174). Also depicted are the predicted structures of human ATG2A and VPS13A in a ribbon representation, with the C-terminal sequences that were exchanged depicted in cyan and green, respectively. (C) Immunoblot showing co-IP from cells stably expressing ATG2A WT and ATG2A−VPS13A chimera using GFP−ATG9A or GFP control. 1.25% of total lysate was loaded as input. The asterisk (*) denotes a non-specific band. Results shown in C are representative of three repeats. (D) Representative immunoblot of ATG2AB DKO cells stably expressing either empty vector (−), ATG2A WT or ATG2A−VPS13A chimera (ATG2A Chim). Cells were in either full medium, starvation medium (starved) or starvation medium with Bafilomycin A1 (Baf) for 3 h and analyzed for LC3B. Tubulin was used as a loading control. Each datapoint in the graph represents the normalized ratio between LC3B-II and tubulin signals and depicts an independent experiment (n=6). The mean±s.d. is also indicated. ****P<0.0001; NS, not significant (one-way ANOVA with Dunnett’s multiple comparisons test). The asterisk (*) denotes a non-specific band.

