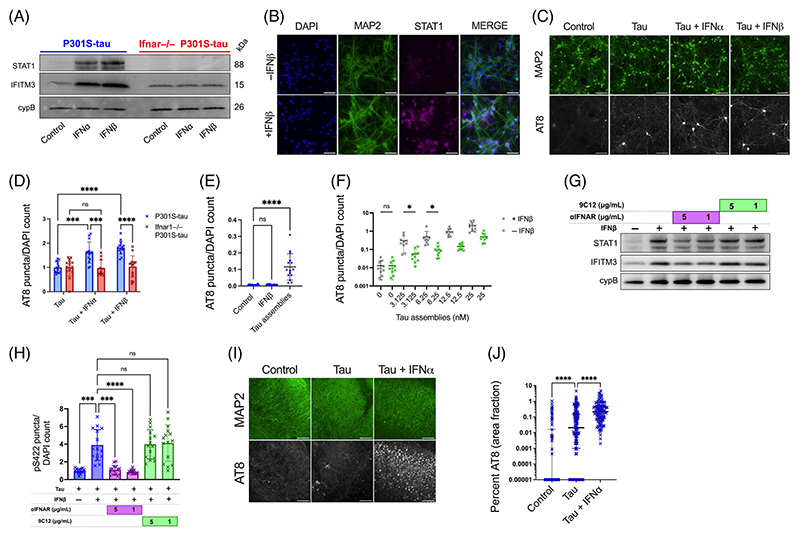
FIGURE 2. Type-I interferons increase seeded tau aggregation.
(A) Mixed neural cultures from Ifnar1+/+ P301S-tau or Ifnar1−/− P301S-tau transgenic mice were treated overnight with IFN-α or IFN-β and expression of interferon-stimulated genes (ISGs) IFITM3, and STAT1 was measured by western blot. (B) Representative immunofluorescence images of STAT1 and MAP2 staining in cultures from Ifnar1+/+ P301S-tau mice following overnight incubation with IFN-β. (C) Mixed neural cultures from Ifnar1+/+ P301S-tau or Ifnar1−/− P301S-tau mice were treated with tau assemblies (‘Tau’) (50 nM) with/without repetitive treatment of IFN-α or IFN-β (50U/mL). Seeded tau aggregation was measured by immunofluorescence staining and quantified in (D); n = 5, N = 3 independent experiments. (E) Seeded tau aggregation was quantified in Ifnar1+/+ P301S-tau cultures treated with IFN-β (50 U/mL) alone or tau assemblies (50 nM) alone; n = 5, N = 3 independent experiments. (F) Tau assemblies were titrated onto Ifnar1+/+ P301S-tau cultures treated with IFNβ (50 U/mL) and seeded aggregation quantified; n = 5, N = 2 independent experiments. (G) Ifnar1+/+ P301S-tau cultures were treated with a type-I IFN receptor blocking antibody (αIFNAR) or a non-targeting IgG isotype control antibody, anti-adenovirus 9C12 (1 h at 5 μg/mL or 1 μg/mL), before overnight treatment with IFN-β (50 U/mL). Expression of IFITM3 and STAT1 was measured by western blot. (H) Seeded tau aggregation was quantified in Ifnar1+/+ P301S-tau cultures pretreated with IFN-β and αIFNAR or 9C12 (1 h at 5 μg/mL or 1 μg/mL) and seeded with tau assemblies; n = 5, N = 2 independent experiments. (I) Representative images of seeded tau aggregation in OHSCs from P301S-tau mice treated with tau assemblies (1000 nM) ± IFN-α (50 U/mL) and stained with AT8. (J) Quantification of seeded tau aggregation measured by immunofluorescence; slices from N = 6 mice. Western blots representative of N = 3 independent experiments. n = wells/condition, each containing 30,000 plated cells. All error bars indicate mean ± SD, except for H, where median and interquartile range is presented. Scale bars = 100 μm. Significance calculated by two-way ANOVA for D and Kruskal–Wallis test with Dunn’s correction for E, H, and J and without Dunn’s correction in F. *p < 0.05; ***p < 0.001; ****p < 0.0001; ns, not significant.

