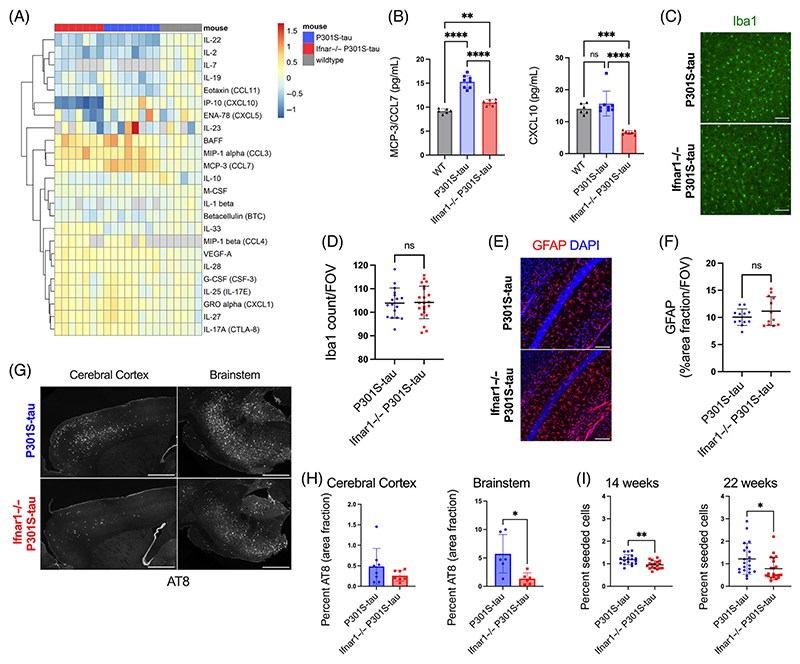
FIGURE 4. Genetic depletion of Ifnar1 reduces tau pathology in vivo.
(A) Cortical cytokine profile of wildtype (n = 6 M), Ifnar1+/+ P301S-tau (n = 3 M, n = 4 F), Ifnar1−/− P301S-tau (n = 4 M, n = 3 F) mice at 22 weeks of age, measured by Luminex 48-plex assay. Data presented are log2 of cytokine concentration (pg/mL), which was normalized to average of WT controls for each cytokine. Gray = not detected. (B) Replot of selected cytokines CXCL10 and CCL7 observed to be significantly different between Ifnar1+/+ and Ifnar1−/− P301S-tau animals. Subanalysis of male-only mice showed the same effects. (C) Representative images and (D) quantification of Iba1 staining in cerebral cortex of Ifnar1+/+ P301S-tau and Ifnar1−/− P301S-tau mice. Points represent n = 3/4 sections/mouse from Ifnar1+/+ P301S-tau (n = 3 M, n = 3 F), Ifnar1−/− P301S-tau (n = 3 M, n = 3 F) mice. (E) Representative images and (F) quantification of GFAP staining in hippocampus of Ifnar1+/+ P301S-tau and Ifnar1−/− P301S-tau mice. Points represent n = 3 or 4 sections/mouse from Ifnar1+/+ P301S-tau (n = 2 M, n = 2 F), Ifnar1−/− P301S-tau (n = 2 M, n = 2 F) mice. (G) Representative images and (H) quantification of AT8 staining in 22-week-old Ifnar1+/+ P301S-tau and Ifnar1−/− P301S-tau brain sections. Points represent average of n = 3 sections/mouse (at least n = 6 mice per group, n = 3 M and n = 3 F in each group). (I) Quantification of seeded tau aggregation in HEK293 cells expressing P301S tau-venus, treated with spinal cord homogenate from Ifnar1+/+ P301S-tau, Ifnar1−/− P301S-tau at 14 weeks (n = 6 mice per group, n = 3 M and n = 3 F in each group) and 22 weeks (n = 7 mice per group). Points represent n = 3 technical replicates per animal. Scale bar = 100 μm for C, E and 1000 μm for G. Significance calculated by one-way ANOVA for B, Welch’s t-test for D, F, and I, and Mann–Whitney test for H. *p < 0.05; **p < 0.01; ***p < 0.001; ****p < 0.0001; ns, not significant. Mean and SD are presented.

