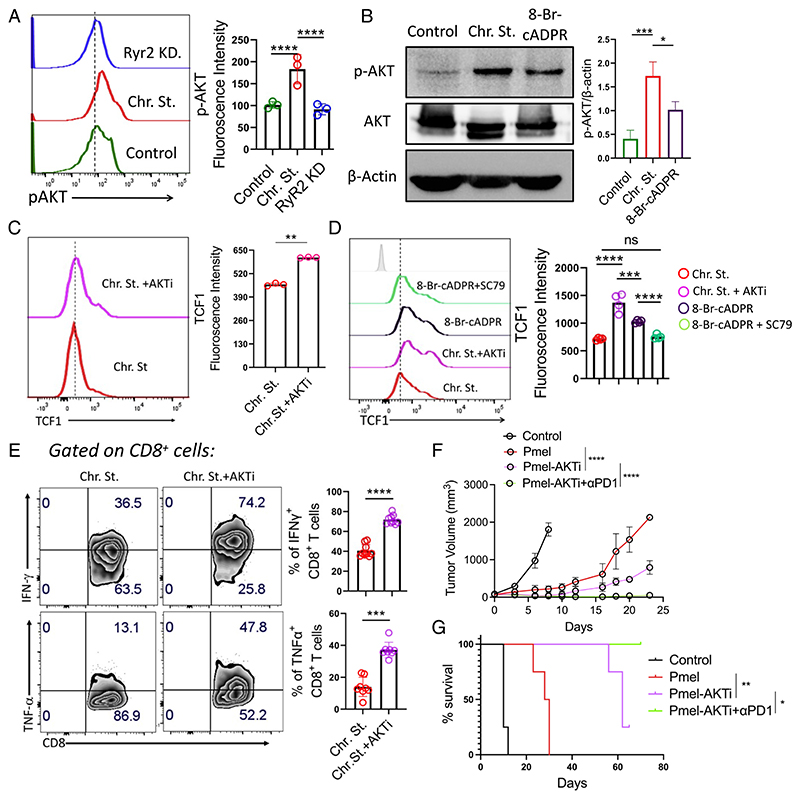
Fig. 6. CD38–RyR2 axis, by promoting AKT activation, impedes TCF1 expression in exhausted T cells.
(A and B) Expression of p-AKT level (Ser473) in (A) control and chronically stimulated T cells transduced with either control shRNA or Ryr2 shRNA by flow cytometry and (B) control and chronically stimulated T cells treated with either vehicle control or 8-Br-cADPR by western blot. (C and D) TCF1 expression in (C) chronically stimulated T cells treated with or without AKTi and (D) chronically stimulated T cells treated with either AKTi or 8-Br-cADPR or 8-Br-cADPR+SC-79. (E) Chronically stimulated CD8+ T cells expanded in the presence or absence of AKTi were checked for their cytokine production by flow cytometry. (F and G) C57BL/6 mice (n = 4/group) bearing B16-F10 tumor were either kept untreated or adoptively transferred with 0.75 × 10⁶ Pmel T cells activated in the presence or absence of AKTi. Groups of mice receiving Pmel-AKTi T cells were either administered with control IgG or Anti-PD1 antibody (200 μg/mouse, thrice per week). (F) Data in the figure demonstrate the mean tumor volume at different time points. (G) KM curves for time-to-killing for experimental conditions are shown. Data are representative of (A) three (cumulative data of mean fluorescence intensity), (B) three, (C) three (cumulative data of mean fluorescence intensity), (D) four (cumulative data of median fluorescence intensity, and (E) eight independent experiments. *P < 0.05; **P < 0.01; ***P < 0.005; ****P < 0.0001; ns, nonsignificant.

