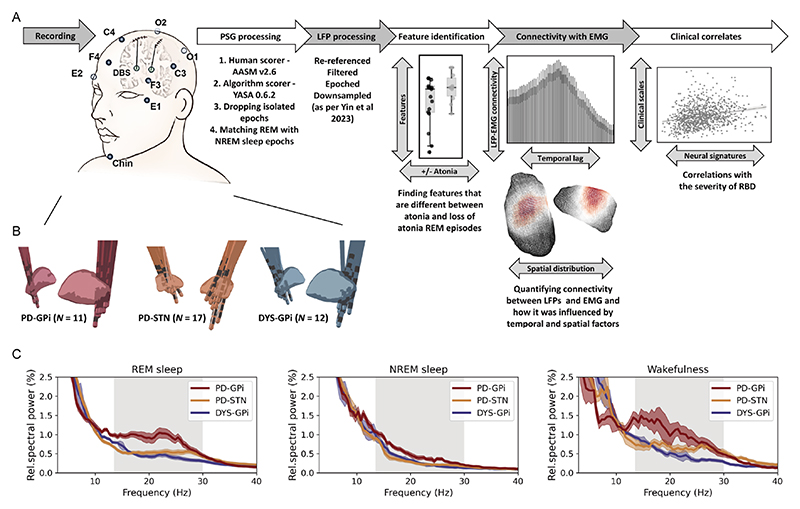
Figure 1. Data recording/processing pipeline and basal ganglia power spectra across groups.
(A) Summary of the data recording and processing pipeline. See text for more details. (B) Localisation of deep brain stimulation electrodes in three groups of patients. (C) Average power spectra in different sleep states across three groups of patients. The shaded area indicates SEM. The beta band range is highlighted in grey. EMG, electromyogram; LFP, local field potential; NREM, non-rapid eye movement; PSG, polysomnography; REM, rapid eye movement; RBD, rapid eye movement sleep behaviour disorder.

