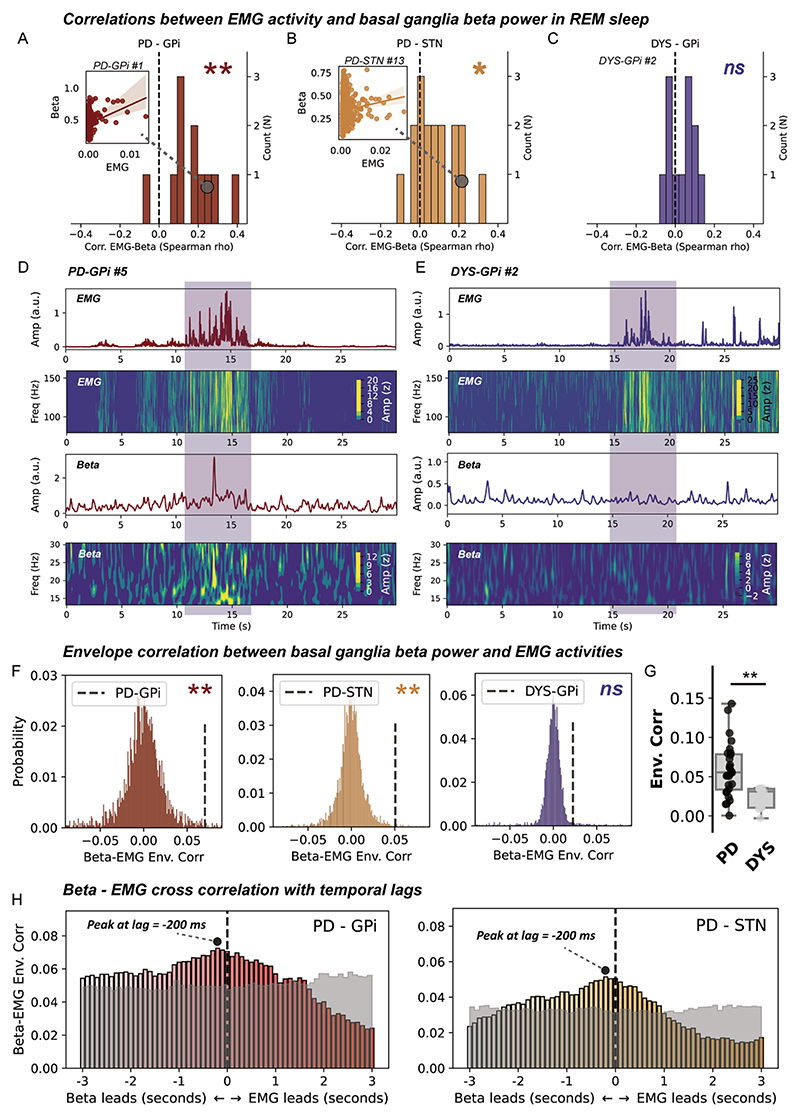
Figure 3. Correlation and connectivity between basal ganglia beta power and electromyogram (EMG) activities during rapid eye movement (REM) sleep.
(A–C) The distributions of episode-wise correlation coefficients between basal ganglia beta power and chin EMG activities in three groups of patients. N in the y-axis represents the number of patients. Insets are regression plots demonstrating the correlation between beta power and integrated EMG in exemplary cases. **P<0.01. *p<0.05. ns, non-significant. Test against zero using Wilcoxon signed-rank test. (D) A case demonstration (from subject PD-GPi #5) showing 30 s of simultaneously recorded chin EMG activities and basal ganglia beta power in Parkinson’s disease (PD). The first row shows the average power envelope of EMG activities filtered between 80 and 160 Hz. The second row shows the corresponding time–frequency representations of EMG activities. The third row depicts the average basal ganglia beta power filtered between 13 and 30 Hz. The fourth row shows the time–frequency representations of basal ganglia beta activities. (E) A case demonstration (from subject DYS-GPi #2) showing 30 s of simultaneously recorded chin EMG activities and basal ganglia beta power in dystonia. The layout of the panel is the same as in (D). (F) Beta-EMG connectivity as assessed using envelope correlation is tested against time-block shuffled surrogates (n=200 for each epoch) in three groups of patients. **P<0.01. ns, non-significant, permutation test. (G) Beta-EMG envelope correlation is compared between patients with PD and dystonia. For box plots, the lower and upper borders of the box represent the 25th and 75th percentiles, respectively. The centerline represents the median. The whiskers extend to the smallest and largest data points that are not outliers (1.5 times the IQR). **P<0.01. Mann-Whitney U test. (H) Time-lagged cross correlation between beta and EMG activities in two groups of patients with PD. The magnitude of correlation peaks at −200 ms favouring beta leading in both the PD-globus pallidus internus (GPi) and PD-subthalamic nucleus (STN) groups. The transparent grey area represents the 97.5th percentile of correlation coefficients in time-block shuffled surrogates at each temporal lag. Cross-correlation values below the grey area are considered non-significant under no correction.

