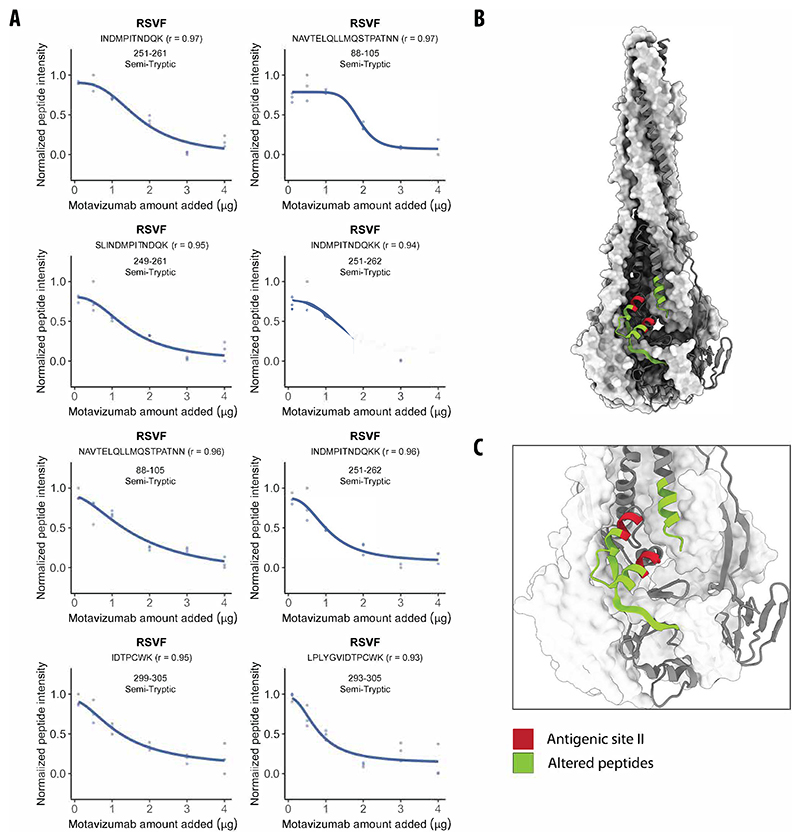
Figure 2. LiP–MS detects protein–protein interactions in complex proteomes.
(A) Dose-response curves of eight LiP peptides with indicated amino acid positions originating from postRSVF show relative peptide intensities proportional to the amount of motavizumab spiked into HEK293T cellular extracts (n = 3 replicates each). Pearson’s coefficient (r) to a sigmoidal trend of the peptide-intensity response profile is indicated. These peptides correspond to the altered peptides (green) in panels (B) and (C). (B) The structure of postRSVF (PDB: 3RRR) (McLellan et al, 2011) with peptides altered in the dose-response analysis (r > 0.85; |log2 FC|>0.75; moderated t-test, q value <0.01) indicated in green and antigenic site II in red. (C) Zoom of the altered peptides on the structure of postRSVF (PDB: 3RRR) (McLellan et al, 2011) with colors as in panel (B).

