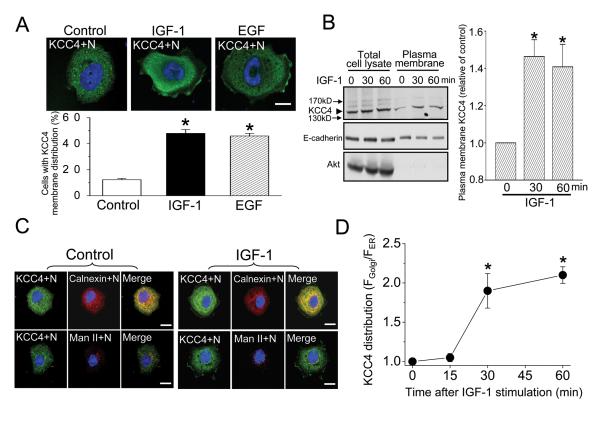
Figure 2. Membrane trafficking of KCC4.
(A) EGF and IGF-1 stimulate the membrane recruitment of KCC4. Ovarian cancer OVCAR-3 cells were incubated in the absence (control group) or presence of EGF (100 ng/ml) or IGF-1 (100 ng/ml) for 30 min. Upper panel: representative pictures from 6 different experiments. Lower panel: the quantitative analyses of KCC4 membrane trafficking in response to growth-factor stimulation. Each column represents mean ± S.E.M. of at least 250 cells. *P<0.01 by unpaired t test. N:nucleus. Scale bar, 10 μm. (B) IGF-1 increases KCC4 surface expression, detected by surface biotinylation assay. Total cell lysates were prepared in parallel for comparison. Akt: a marker of cytosolic protein; E-cadherin: an internal control of membrane protein. Left panel: a representative immunoblot. Right panel: the densitometric quantification of KCC4 surface expression. Each column represents mean ± S.E.M. (n=3). *P<0.01 by paired t test (C) & (D) IGF-1 stimulates KCC4 redistribution between ER and Golgi. (C) Representative confocal images of ovarian cancer OVCAR-3 cells incubated with or without 100 ng/ml IGF-1 for 30 min. Calnexin: ER marker protein; Man II: mannosidase II, Golgi marker protein. Scale bar, 10 μm. (D) The ratio of mean fluorescence intensity of KCC4 in the Golgi (FGolgi) over its mean fluorescence intensity in the ER (FER) was calculated at different time points and used as a measurement of KCC4 redistribution. Each points represents mean ± S.E.M. of at least 60 cells. *P<0.01 by paired t test

