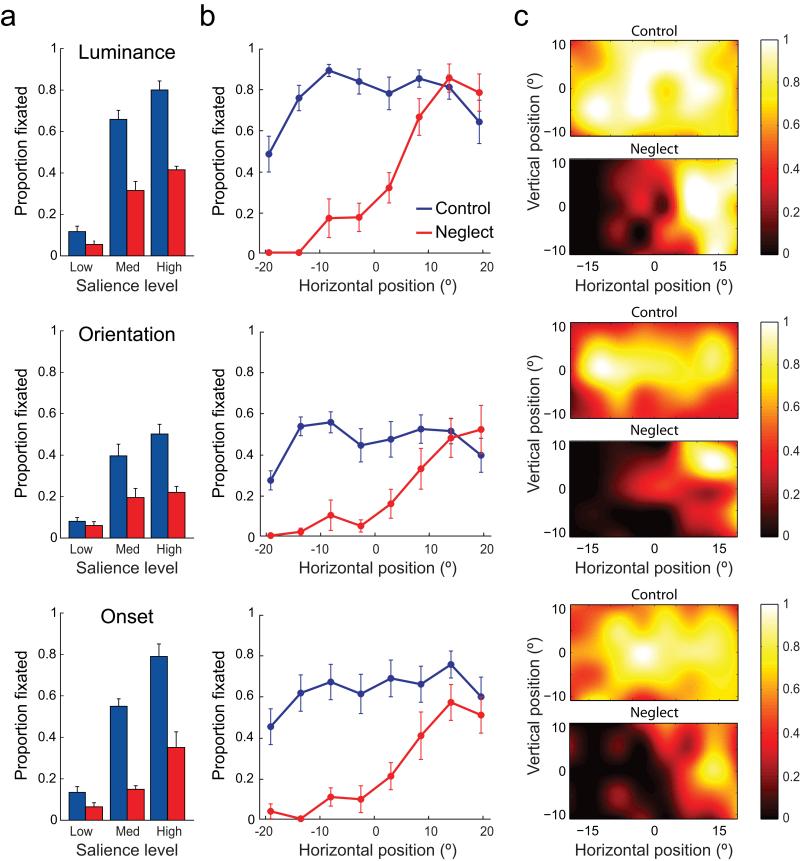
Figure 3. Stimulus-driven orienting to probes.
(a) Proportion of luminance (top), orientation (middle), and prior onset (bottom) probes fixated by control subjects (blue) and neglect patients (red), as a function of the probe’s salience level. Error bars indicate s.e.m.
(b) Proportion of probes fixated as a function of the horizontal position of the probe, from left to right of the display.
(c) Heat maps show the proportion of probes of each type fixated by controls (top) and patients (bottom) as a function of 2d probe position. Note how more centrally-located probes attract a greater proportion of control subject’s fixations.

