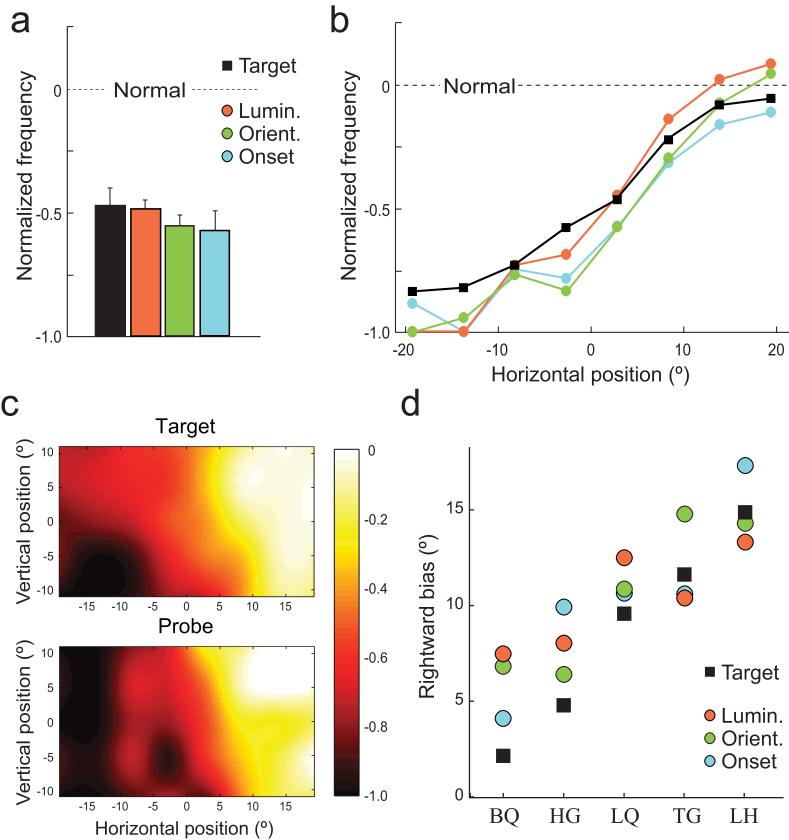
Figure 4. Comparison of neglect deficits for goal- and stimulus-driven orienting.
(a) Normalized frequency of patient fixations on targets (black) and luminance (red), orientation (green) and onset (blue) probes. A normalized ratio of 0 indicates no difference between patient and control performance; -1 indicates complete patient impairment. Error bars indicate s.e.m.
(b) Normalized fixation frequency as a function of horizontal position for targets (black lines) and probes (colored lines).
(c) Normalized frequency as a function of 2d position, for targets (top) and probes (bottom).
(d) Rightward bias in orienting to targets (black squares) and probes (colored circles) for each patient. Note the strong correlation between a patient’s bias in orienting to probes and to targets.

