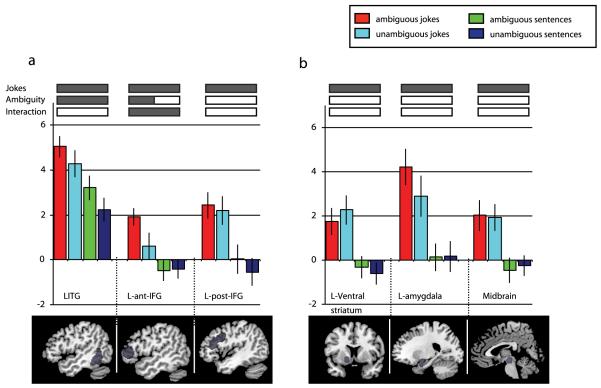
Figure 1.
Illustrates results from the ROI analysis, calculated for the main effects (ambiguity and joke/non-joke) and interaction. Bars show beta values (peak voxels for each of the stimuli conditions. a) Bottom, sagital brain images showing in grey the cortical ROIs; b) bottom, subcortical ROIs.
All regions showed Jokes vs. non-jokes effects while Ambiguity effect it was only seen in LITG and L-ant-IFG (marked with diagonal bars). The interaction was significant in the L-ant-IFG (as marked with a diagonal bar for the jokes and a horizontal bar for the sentences). Error bars display the standard error of the mean. LITG=left inferior temporal gyrus; L-post-IFG=left posterior inferior frontal gyrus; L-ant-IFG=left anterior inferior frontal gyrus.

