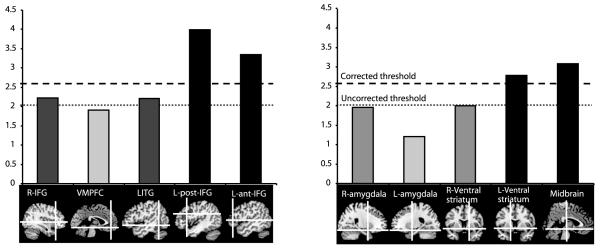
Figure 2.
Illustrates results from the focused ROI analysis, calculated for the funniness correlation. Bottom, sagittal brain images showing the cortical ROIs, on the right, and the subcortical ROIs, on the left. L-post-IFG, L-ant-IFG, Left ventral striatum and midbrain ROIs showed significant correlation with funniness ratings, corrected for multiple comparisons. R-IFG and LITG were significantly correlated with funniness but at uncorrected levels.

