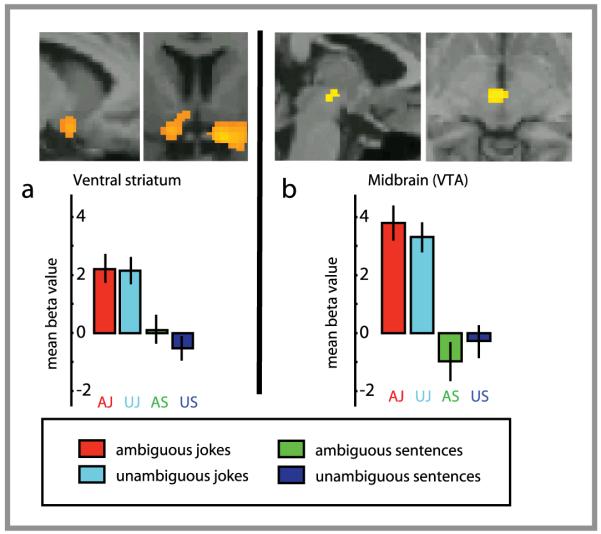
Figure 4.
shows fMRI response for simple contrast between Jokes and non-jokes. A For display, contrasts are thresholded at P< 0.001 uncorrected for whole-brain comparisons. Activation maps are rendered onto canonical T1 brain images. Figure 4a left, sagittal view of the left ventral striatum activation; 4a right, coronal view of the ventral striatum bilaterally spreading to the right amygdala. 4b, sagittal and coronal views of midbrain activation. Insets show beta values (peak voxels for each of the stimuli conditions).

