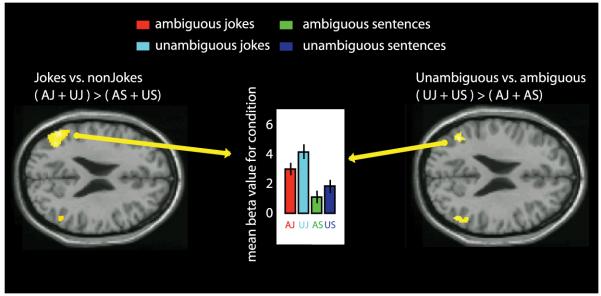
Figure 5.
shows fMRI response for simple contrast between jokes and non-jokes and unambiguous stimuli vs. ambiguous stimuli. Contrasts are thresholded at P< 0.001 uncorrected for whole-brain comparisons and activation maps are rendered onto axial canonical T1 brain images. Axial view left, TPJ activity in the main jokes contrast ( AJ + UJ ) > ( AS + US). Axial view right, TPJ activity for unambiguous vs. ambiguous stimuli ( UJ + US ) > ( AJ + AS). Middle, central bar graph, mean beta values for each condition showing higher activity of the jokes over the non-jokes, and higher activity of combined unambiguous sentences and jokes over ambiguous sentences and puns.

