FIG. 3.
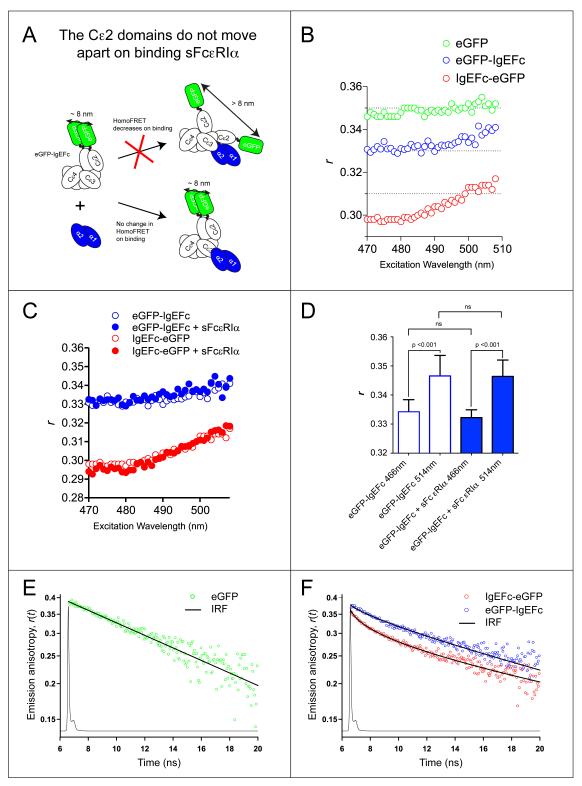
HomoFRET in eGFP-IgEFc and IgEFc-eGFP does not change on binding to sFcεRIα. A: Cartoon illustrating how homoFRET could be used to detect independent movements of polypeptide chains in the IgEFc homodimer on binding to sFcεRIα. B: Anisotropy excitation scan of either eGFP alone (green circles), eGFP-IgEFc (blue circles) or IgEFc-eGFP (red circles). HomoFRET occurs in both constructs as shown by the significantly lower emission anisotropy (r) at lower excitation wavelengths and the increase in r with excitation wavelength. C: sFcεRIα binding has no effect on the anisotropy excitation scans of either eGFP-IgEFc (blue circles) or IgEFc-eGFP (red circles). D: Repeat measurements of steady-state anisotropies of eGFP-IgEFc at two wavelengths. Data represents the average and standard deviations for n = 9 independent measurements. Significant values were determined using a one-way ANOVA with Tukey-Kramer test. The absence of any change on binding sFcεRIα confirms that there is no significant change in orientation between the Cε2 domains. E: Semi-log plot showing the anisotropy decay r(t) for eGFP alone, with raw data 5-point averaged for display purposes only (green circles). The fit line passing through the decay data is the best-fit impulse response for eGFP rotation (see Supplemental Information for details). The overlaid line graph shows the instrument response function (IRF). The anisotropy decay of eGFP (in the absence of homoFRET) is monoexponential and thus appears linear in this semi-log plot. F: Semi-log plot showing the anisotropy decays for eGFP-IgEFc (blue circles) and IgEFc-eGFP (red circles). Raw data was 5-point averaged for display purposes only with the lines passing through the data points being the theoretically calculated anisotropy decays based on the models (for a detailed description see Supplementary Information). The pronounced curvature of the decays in this semi-log plot demonstrates the expected deviation from monoexponential decay kinetics due to homoFRET.

