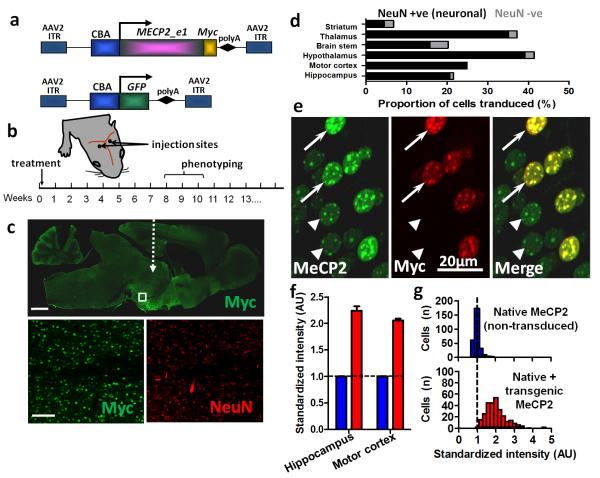
Figure 1. Widespread expression of exogenous MeCP2 across the brain following neonatal delivery via an AAV2/9 vector.
a. MECP2_e1/Myc fusion and GFP (control) constructs were cloned into AAV2 backbones under a CBA promoter. b. Experimental plan in which male wild-type (WT) or Mecp2-/y mice were injected intracranially with AAV9/CBA-MECP2 at P0-2, scored for the progression of RTT-like signs from 3 weeks onwards and phenotyped quantitatively at weeks 8-10. c. Representative micrograph (whole brain, parasagittal section) showing the distribution of Myc-tagged MeCP2 expression in a 12 week old WT mouse following bilateral injection. White dashed arrow indicates approximate injection site. Insets are higher power micrographs corresponding to the box in the large image showing proportion of Myc +ve (transduced cells) relative to the NeuN-immunolabelled cell population. d. Quantification of transduction efficiency (as a proportion of DAPI-stained nuclei) revealed widespread, mainly neuronal, distribution across a range of CNS regions. e. Micrograph showing transduced and non-transduced cells in hippocampal area CA3 in a WT male mouse. At a cellular level, exogenous MeCP2 (revealed by Myc immunoreactivity) was localized to neuronal nuclei with a punctate distribution characteristic of proteins that colocalise with heterochromatin. f. Injection of AAV9/MECP2 into WT mice led to augmentation of MeCP2 levels (native + transgenic) in transduced cells and enabled quantification of relative transgenic MeCP2 abundance. Blue bars show native MeCP2 levels in non-transduced cells and red bars show levels of native + transgenic MeCP2 in transduced cells. Transduced cells exhibited mean levels of anti-MeCP2 immunofluorescence that were 105 - 124% higher than mean basal levels in untransduced nuclei. g. Distribution of MeCP2 level (immunofluorescence intensity) in transduced and non-transduced layer V pyramidal cells (primary motor cortex) from 4 injected brains. Analysis revealed native MeCP2 levels to be tightly regulated (narrow peak) while levels in transduced cells showed a broader and positively shifted distribution. Scale bars: c top, 1mm; c, bottom,100μm. Abbreviations: polyA, SV40 polyadenylation signal; CBA, chicken beta actin promoter; ITR, inverted terminal repeat; NeuN, ‘neuronal nuclei’ antigen (Rbfox3); AU, arbitrary units. Bars show mean ± SEM.

