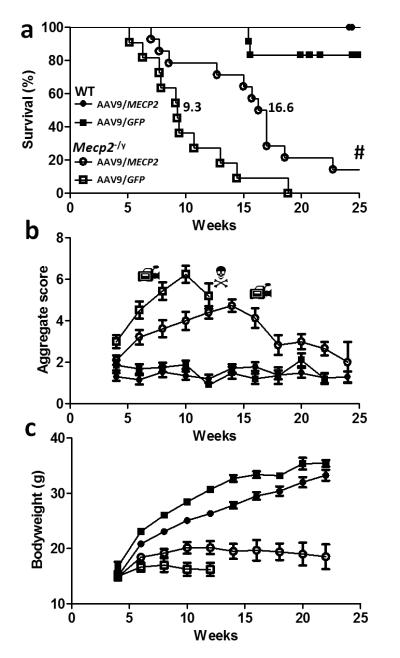
Figure 2. Enhanced survival and reduced RTT-like signs following neonatal delivery of ssAAV9/CBA-MECP2.
a. Survival plot showing extended lifespan of Mecp2-/y mice injected with AAV9/CBA-MEPC2 (open circles, n=14) compared to AAV9/GFP injected controls (open boxes, n=11). The median survival period was significantly increased from 9.3 weeks to 16.6 weeks (P<0.0001 Gehan-Breslow-Wilcoxon test). The plot also shows absence of lethality associated with overexpression of MeCP2 in AAV9/MECP2-treated wild-type mice (filled circles, n=12). Filled boxes show data from AAV9/GFP-treated wild-type mice (n=12). b. Plot showing aggregate phenotype severity score in the mice used for survival analysis in a. The rate of phenotype progression in AAV9/MECP2-treated null mice was reduced compared to the aggressive phenotype trajectory seen in AAV9/GFP control-injected mice (P<0.05, Repeated measures ANOVA between weeks 3-12). In contrast, wild-type mice injected with AAV9/MECP2 and AAV9/GFP showed no difference between groups and no change in score over the study. c. Plot showing bodyweight changes over time in the same mice. There was a genotype effect (repeated measures ANOVA, P<0.05) but no significant treatment effect. Video camera symbols indicate time points at which movies were made (see supplemental files S1-3). # Indicates two AAV9/MECP2-treated Mecp2-null mice that survived to the end of the 30 week study (see supplementary figure 2). N Indicates that in the null untreated group, insufficient mice were still alive to plot the mean score after 12 weeks.

