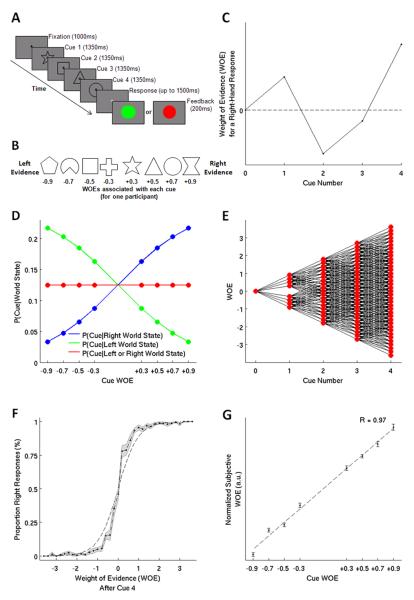
Figure 1. Experimental Task and Behavior.
(A) A typical trial, with four cues providing evidence about the response. (B) The set of cue shapes and their mappings onto WOEs for one participant. (C) A schematic of integrated WOE fluctuations over an example trial. At the end of the trial the evidence favors a ‘right’ response. (D) The relationship between cue WOEs and the probabilities of observing each cue given a left or right world state, and on average. (E) All possible evidence states at each stage in the task (red dots) and all possible trajectories that can lead to each state (black lines). (F) Participants’ responses accurately reflected the integrated WOE after the fourth cue shape. The dashed line describes a probability-matching response pattern. (G) Participants’ subjective WOEs strongly correlate with the objective cue WOEs.

