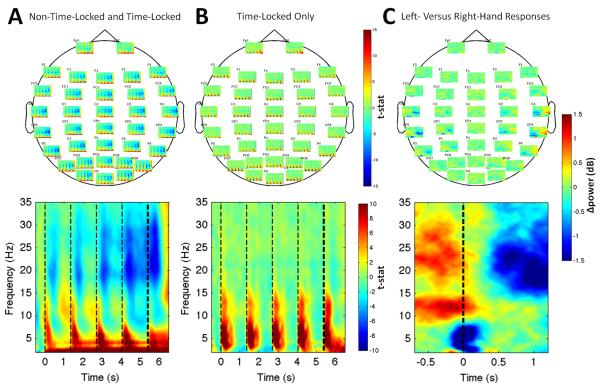
Figure 2. Overall and Evoked Time-Frequency Effects During Decision Making and After Responses.
In (A) the overall response but not (B) the time-locked response, alpha (8-14 Hz) and beta (15-25 Hz) modulation followed presentation of cue stimuli and progressively desynchronized over the trial. Upper panels: average effects at individual sensors. Lower panels: effects averaged across sensors. (C) Topography of the beta rebound lateralization is evident in the average time-frequency map for the subtraction of left- and right-handed responses. The lower panel shows the further subtraction between the left-hemisphere ROI (C3, CP3) and right-hemisphere ROI (C4, CP4). Light vertical lines: onset times of cue stimuli. Heavy dashed lines indicates onset of the go cue in (A) and (B), and the response time in (C).

