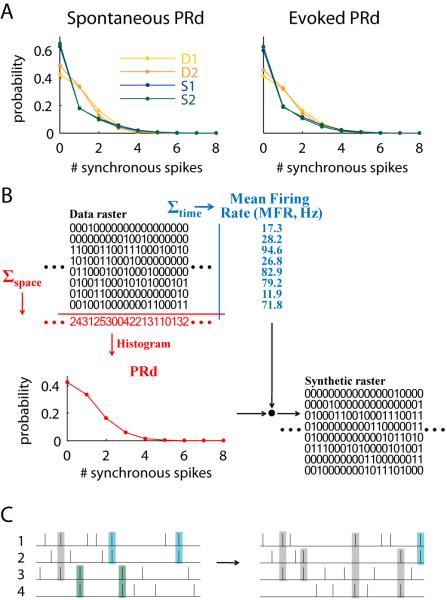
Figure 2.
The raster marginals model. (A) Population Rate distribution (PRd) of spontaneous and evoked activity in each of the recording intervals shown in Fig. 1C. (B) Illustration of the model. Summing the rows of the raster matrix provides the mean firing rate (MFR) for each electrode. Summing columns provides the population rate, whose distribution (PRd) is used by the model. MFR and PRd summarize the raster by 2N parameters, which are used to produce a synthetic raster (see Methods). (C) Illustration of a correlation structure that cannot be captured by the model. Left: spike coincidences predominantly occur between units 1-2 (blue) and 3-4 (green), whereas all other coincidences are rare (gray). Right: in the output produced by the model, coincident spikes occur between any pair of units.

