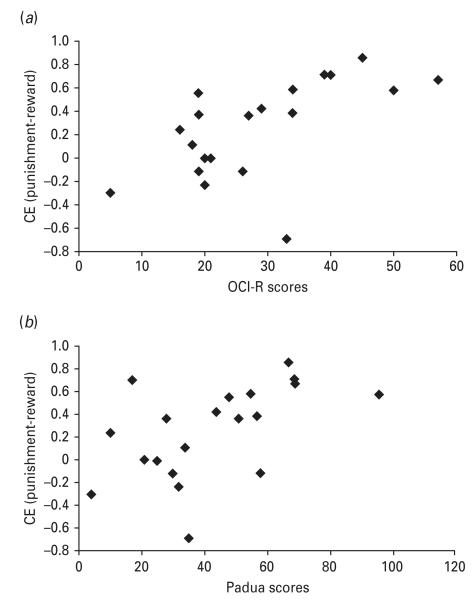
Fig. 4.
(a) Scatterplot of increased commission errors (CE) under punishment and scores on the Obsessive Compulsive Inventory – Revised (OCI-R) in the patient group (Pearson correlation of 0.60). (b) Scatterplot of increased commission errors under punishment and scores on the Padua Inventory – Revised (PI-R) (Pearson correlation of 0.53).

