Figure 4.
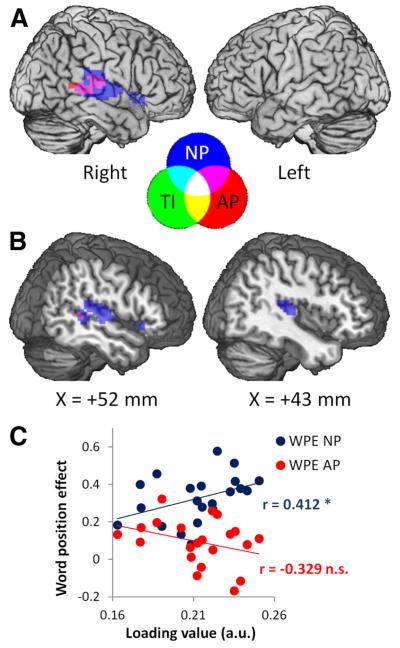
Semantics component. Semantic performance correlated with activity in right temporal regions. A, Surface view showing activity to NP (blue) and AP (red) or both NP and AP (magenta) in RpSTG/MTG, and a small cluster in right IFG (BA47). Central legend shows colors of the feature images and their overlap in A and B. B, Sagittal sections (at the indicated MNI x-coordinate) illustrating the extent of temporal activity. All effects shown at voxel-level p < 0.001 (z > 3.09) and cluster size >1.25 cm3 (approximately p < 0.05 corrected). TI, Tissue integrity. C, Higher loading values from the semantic component correlated with larger WPENP (blue) but not for WPE AP (red). *p < 0.05; **p < 0.01; ***p < 0.001; n.s., not significant; a.u., arbitrary units.

