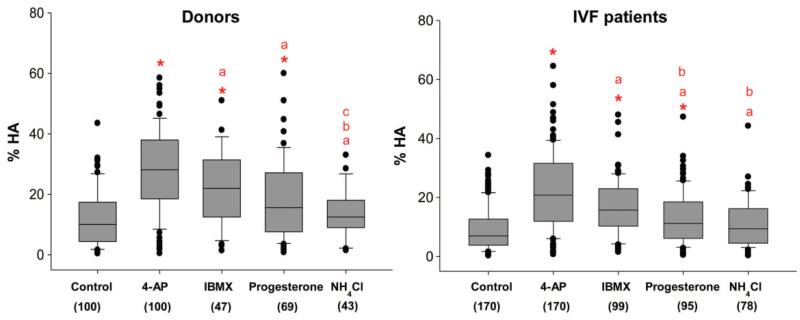
Figure 1.
Comparison of four different agonists on HA) in two populations (donors and IVF patients). Box and whisker plots illustrating the data distribution for HA in the baseline (control) and samples treated with 4-AP, IBMX, progesterone and NH4Cl from donors and IVF patients. The boxes represent the interquartile range and lines within them are the medians. The number in brackets is the sample size. *Highlights that the agonist-induced HA is significantly different to baseline, (a) highlights a significant difference between responses to 4-AP and all other agonists (b) highlights a significant difference between responses to IBMX compared with progesterone and NH4Cl and (c) highlights a significant difference between responses to progesterone and NH4Cl. Significance was considered as P, 0.05 assessed by one-way ANOVA and non-parametric ANOVA on ranks Kruskal–Wallis test. Not all samples were tested with each of the agonists.

