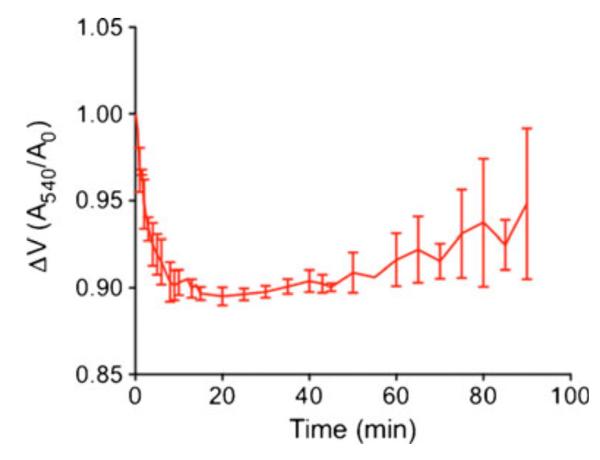
Fig. 1.
Time course of mitochondria swelling in hypotonic solution. Isolated mitochondria were suspended in hypotonic solution (5 mM HEPES, 5 mM sucrose, and 1 mM EGTA pH adjusted to 7.4 with KOH) and volume change due to mitochondrial swelling was monitored as decline in absorbance at 540 nm. Data are expressed as ratio between the change in absorbance over time divided by the absorbance at the initial timepoint (mean±SD, n=3)

