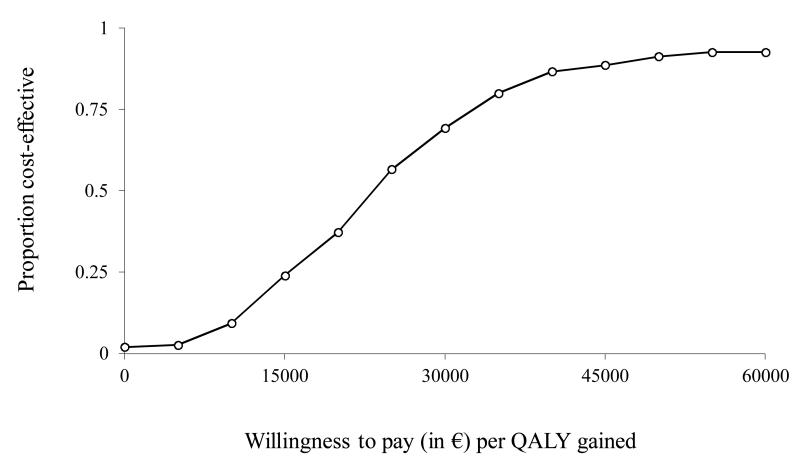
Figure 2.
Example of a cost-effectiveness acceptability curve.
This graph shows the probability of an osteoporotic treatment being cost-effective compared with no treatment in patients aged 70 years with prevalent vertebral fractures, as a function of the decision-maker’s willingness-to-pay per one QALY [108].
The curve was estimated from probabilistic sensitivity analyses where most parameters (such as therapeutic effect, fracture risk, cost, and disutility) were assigned a probability distribution (e.g. normal or uniform distribution) and values from each distribution were randomly selected during a predefined number of simulations.

