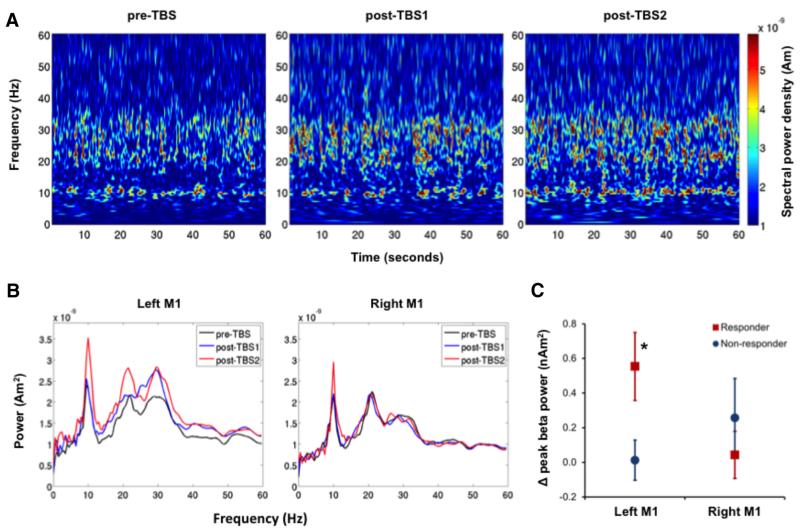
Figure 2.
Effect of cTBS on spontaneous oscillatory beta activity. A, Time-frequency representations of spontaneous oscillatory activity recorded from left M1 in a representative responder participant. Each plot represents 60 s of spontaneous oscillatory activity recorded during each of the three MEG recording blocks. B, Power spectral density profiles of both left M1 and right M1 oscillatory activity were then created for each 60 s period. The peak amplitude of the spontaneous oscillatory power within the beta-band frequency (15–35Hz) was obtained from each 60 s period and averaged across pre-TBS and post-TBS recording blocks. C, Change in oscillatory beta power was calculated as the mean power in the post-TBS minus the mean power in the pre-TBS recording. Data points represent the mean±SEM in responder (red squares) and nonresponder (blue circles) participants. *indicates that the peak beta power recorded from left M1 of responder participants was significantly higher after cTBS (p = 0.012).

