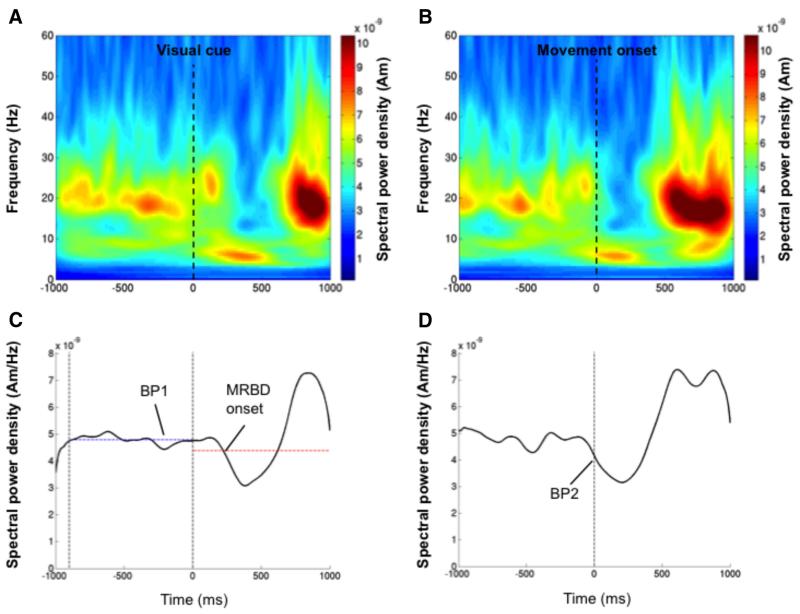
Figure 3.
Measurement of movement-related beta activity. A, Time-frequency representation of the virtual sensor output from the left M1 of a responder participant as they performed abductions of the right index finger. The movement trials from the pre-TBS recording were aligned from −1.0 to +1.0 s around the onset of the visual go-cue. B, Left M1 virtual sensor output as presented in A, but realigned from −1.0 to +1.0s around the movement on set of the right index finger.C,Time course of the averaged spectral power in the beta frequency (15–35Hz) band aligned to the visual cue. The baseline beta power (BP1), which is represented by the blue horizontal dashed line, was calculated as the mean amplitude during the 900 ms before the visual cue onset, as represented by the black vertical dashed lines. The onset of the MRBD was also determined as the first point following the visual cue in which the beta-band power fell <2.5SDs of BP1.This threshold is represented by the red horizontal dashed line.D, Time course of the averaged spectral power in the beta frequency band aligned to the movement onset. The magnitude of the MRBD was calculated by first measuring the power of the beta activity at the movement onset (BP2).To obtain a relative change from baseline this value was then subtracted from the power measured during the baseline period (BP1) in C.

