Figure 5.
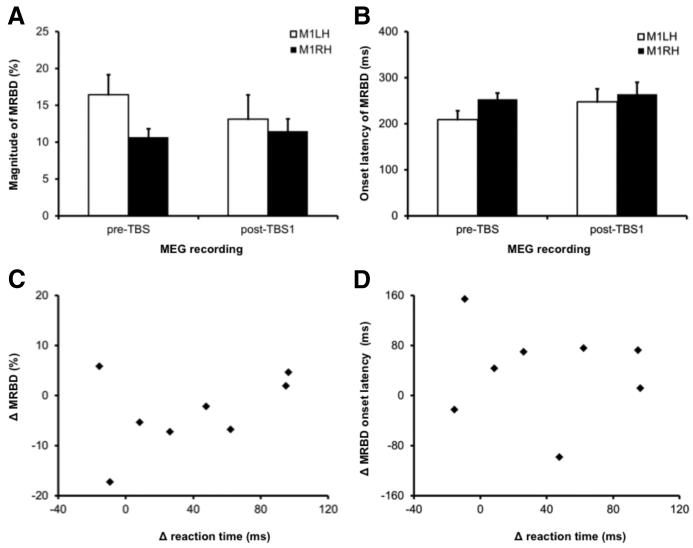
Effect of cTBS on movement-related oscillatory beta activity. A, Percentage magnitude of the MRBD measured from both left and right M1 during abduction of the right index finger in the pre-TBS and post-TBS1 recordings. B, Onset latency of the MRBD measured from both left and right M1 during abduction of the right index finger in the pre-TBS and post-TBS1 recordings.C, The relationship between the change in the power of MRBD from left M1 following cTBS plotted against the change in reaction time in the right index finger. Positive values indicate that reaction times (y-axis) or percentage MRBD magnitude (x-axis) were longer in the post-TBS1 recording as compared with the pre-TBS recording. D, The change in the onset latency of the MRBD from left M1 following cTBS plotted against the change in reaction time of the right index finger. Positive values indicate that reaction times (y-axis) or MRBD onset latency (x-axis) were longer in the post-TBS1 recording as compared with the pre-TBS recording.

