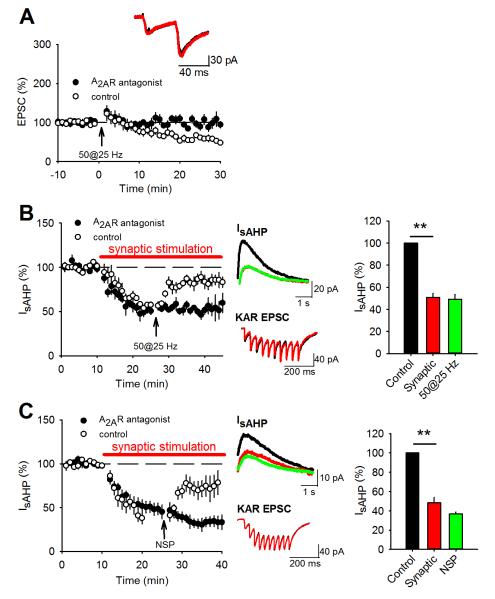
Figure 5. KAR LTD and the relief of IsAHP inhibition require adenosine A2A activation.
(A) Application of the A2AR antagonist ZM 241385 (50 nM) blocked KAR LTD induced by 50 stimuli @25 Hz. Control data from Figure 2A are included for comparison. PPR was unchanged. Example traces show EPSCs during baseline (black) and after HFS (red). (B and C) IsAHP amplitude was depressed by synaptic stimulation of 10 stimuli @ 25 Hz in the presence of the A2AR antagonist but the relief of depression by 50 stimuli @ 25 Hz (B) or the NSP (C) was blocked. Control data from Figures 3B (B) and 3A (C) are included for comparison. Example traces show IsAHPs (top) and synaptic responses (bottom) during baseline (black), after synaptic stimulation (red) and after the 50 stimuli @ 25 Hz or NSP (green). Bar graph shows quantification of IsAHP amplitude depression.

