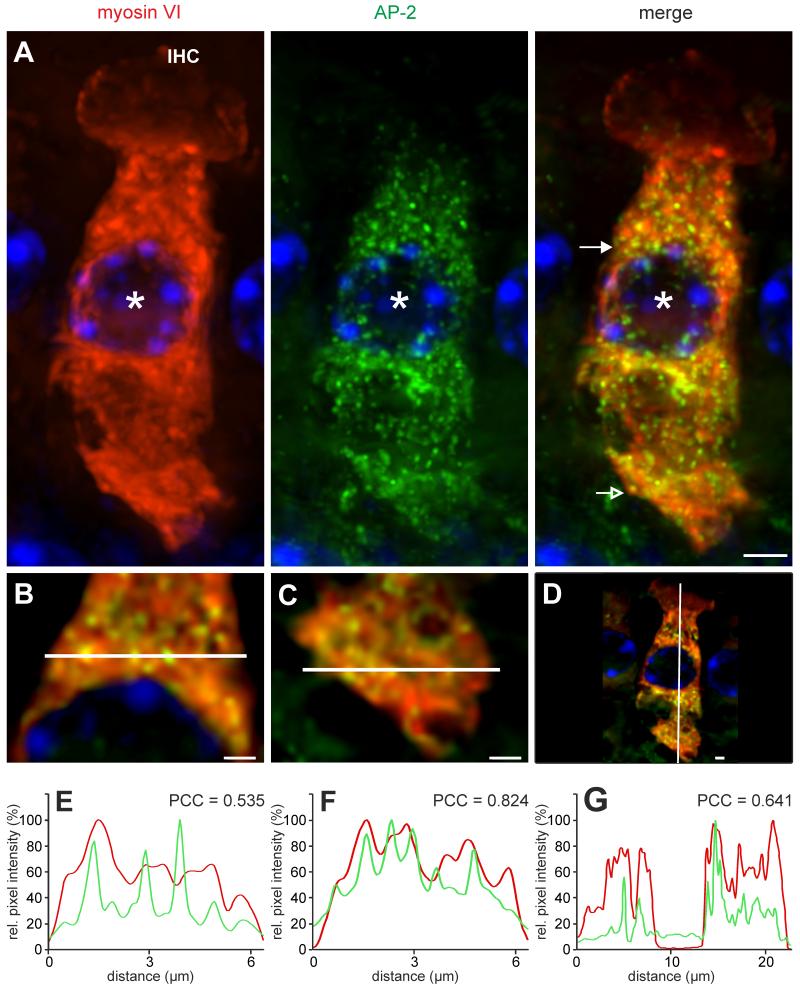
Figure 5.
Co-localization of AP-2 protein and myosin VI in mature (P19) IHCs. A Co-localization of myosin VI (red) and AP-2 (green) labeling was found ubiquitously throughout the IHC except the cuticular plate. Cell nuclei were counterstained with DAPI. Scale bar, 5 μm. B-D To better display co-localization, merged images are shown displaying magnifications of single layers out of the deconvoluted z-stack in (A), where (B) and (E) are derived from the supranuclear area (closed arrow in A, merge), (C) and (F) from the base (open arrow in A, merge), and D and G from a vertical cut. Scale bars, 2 μm. E-G Normalized intensity profiles are drawn from the white lines in (B-D) and show the relative pixel intensity along the line with regards to the distance and fluorescence wave length (red, Cy3; green, Alexa488). Co-localization was analyzed by coinciding of maxima of the red and green channel by Pearson correlation (Pearson correlation coefficient, PCC). Images display maximum intensity projections of all layers of a z-stack.

