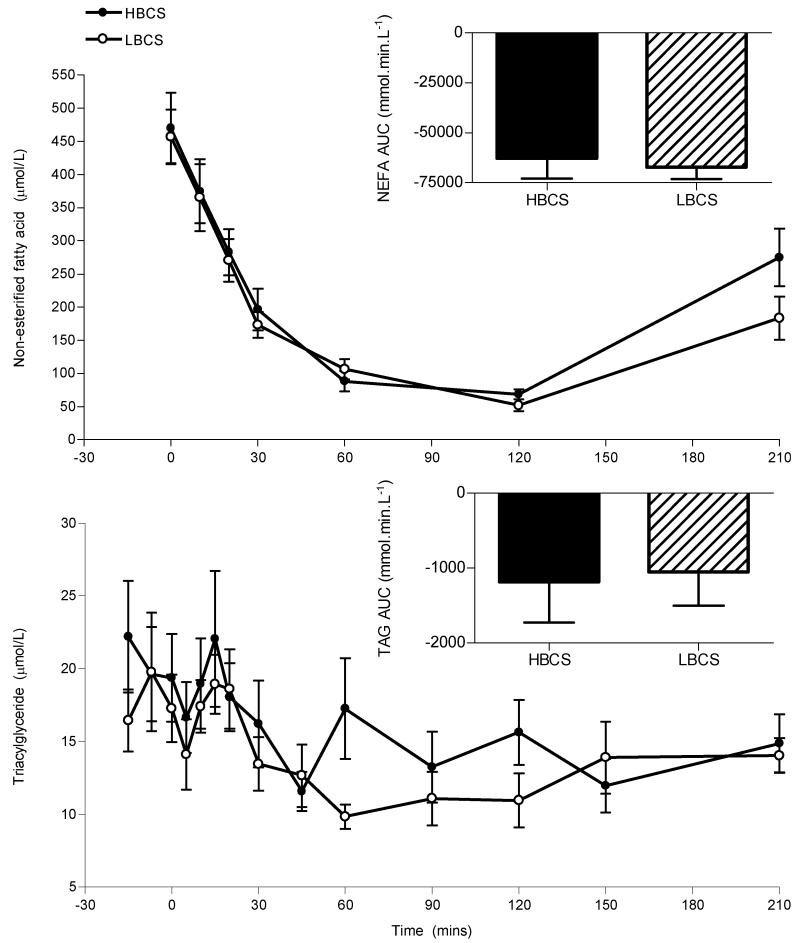
Figure 1.
Plasma non-esterified fatty acid and triacylglyceride during the intravenous glucose tolerance test of offspring of higher body condition score (HBCS, filled bars/symbols) and lower body condition score (LBCS, hatched bars/open symbols) ewes. Data are shown as the mean ± SEM. Area under the curve (AUC) were calculated from baseline plasma levels prior to the glucose bolus.

