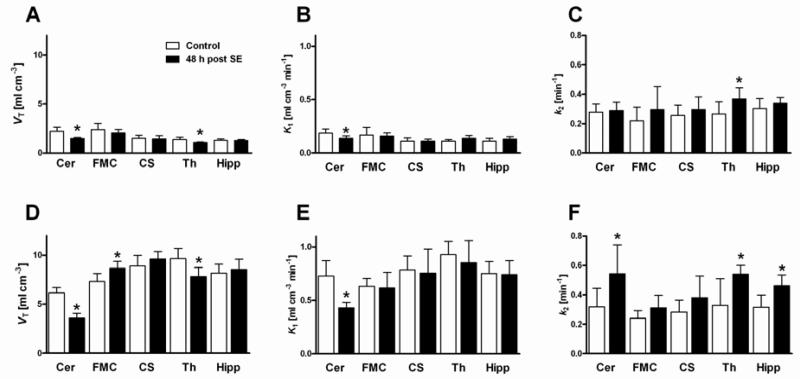
Figure 5.
Outcome parameters of kinetic model analysis of PET data for baseline scans (without tariquidar) and inhibitor scans (3 mg/kg tariquidar; A, D distribution volume, VT; B, E influx rate constant, K1; C, F efflux rate constant, k2) of control and post-status epilepticus (SE) rats in five brain regions. Data are shown as mean ± SD. Significant differences between control and post-SE rats are indicated by asterisk (p ≤ 0.05). Cer, cerebellum; FMC, frontal motor cortex; CS, corpus striatum; Th, thalamus; Hipp, hippocampus.

