Figure 6.
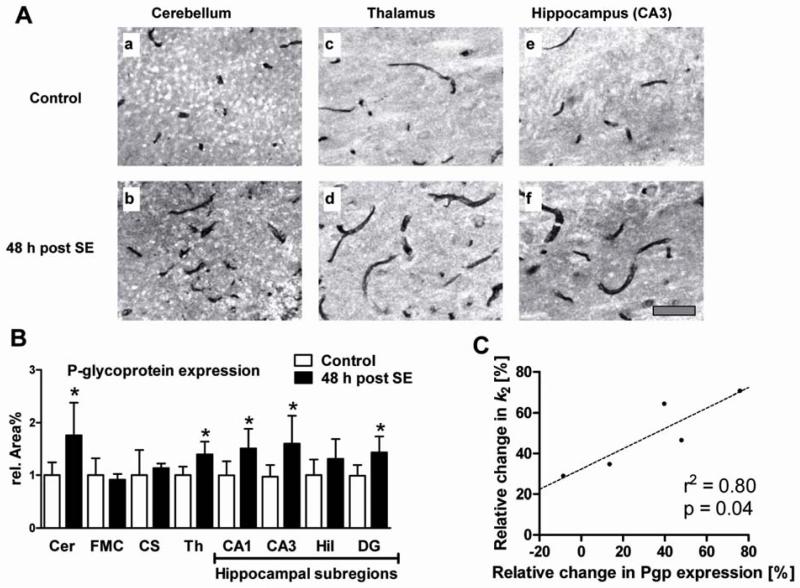
(A) Representative examples of immunostained brain sections of a control rat (a, c, e) and a rat 48 h post status epilepticus (SE; b, d, f). Pgp expression is shown in brain capillaries of 3rd cerebellar lobule (a, b), thalamus (c, d) and hippocampus (e, f). Scale bar in f indicates 50 μm. (B) Pgp expression in endothelial cells of rat brain capillaries in cerebellum (Cer; −9.6 mm relative to bregma, according to Paxinos and Watson (2007)), frontal motor cortex (FMC; +3.2 mm), corpus striatum (CS; −2.3 mm), thalamus (Th; −2.3 mm), and hippocampal subregions (CA1, CA3, dentate gyrus (DG), dentate hilus (Hil); data are means of three analyzed brain levels (−2.3, −3.8, −5.8 mm)) of control and post-status epilepticus (SE) rats. Data are shown as mean ± SD. Significant differences between control and post-SE rats are indicated by asterisk (p ≤ 0.05). (C) Correlation between SE-induced changes in Pgp expression and changes in compartmental-model derived efflux rate constant k2 relative to control group in five different brain regions after partial Pgp inhibition. The dashed line indicates the best fit. P-value and squared Pearson correlation coefficient (r2) are indicated in the graph.

