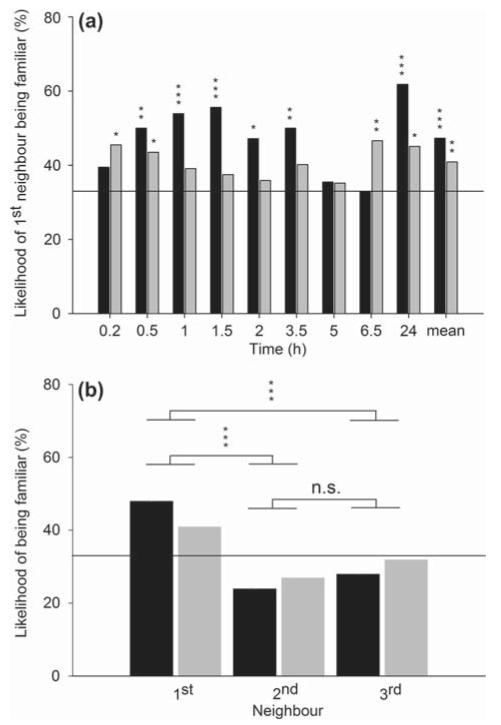
Figure 1.
The percentage of 1st neighbours (a) and of 1st, 2nd and 3rd neighbours (b) being familiar within mixed groups of familiar and unfamiliar P. persimilis females, with either homogeneous (black bars) or heterogeneous (grey bars) genetic background, over time (a) and across time (b), respectively. Asterisks above bars (a) denote the results of separate G-tests for goodness of fit of the observed numbers of 1st neighbours being familiar and unfamiliar with the expected numbers if random (ratio 1:2) for each observation point and the mean numbers across time. Asterisks above horizontal brackets (b) denote the results of pairwise neighbour comparisons (Šidák tests following GEE) (* p < 0.05, ** p < 0.01, *** p < 0.001, n.s. = non-significant). The reference lines represent the expected likelihood of 33% being familiar if random.

