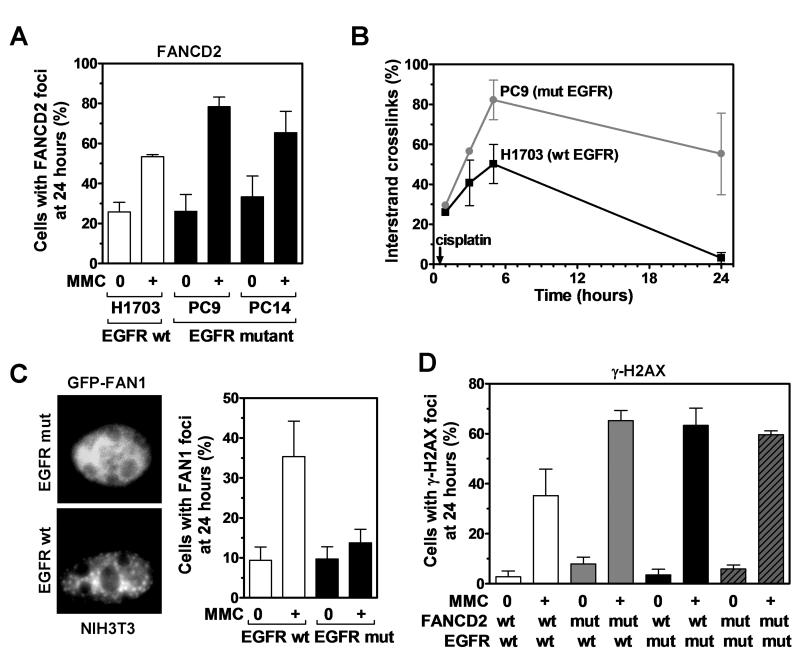
Figure 3.
Relationship between EGFR and the FANCD2 pathway. A, Fraction of nuclei with ≥ 10 FANCD2 foci in wild-type (wt) and mutant (mut) EGFR cell lines 24 hours after MMC treatment (0.5 μg/ml, 1 hour). B, Comparison of ICL repair in wt and mut EGFR cell lines using a modified alkaline comet assay. Cells were treated with 50 μM cisplatin for 1 hour. Immediately before analysis, cells were irradiated with 12.5 Gy to produce a fixed number of DSBs. Results are expressed as a percentage decrease in tail moment (see also Fig. S4A). C, Left panel, Representative immunofluorescence microscopy images for an isogenic MEF pair with wt or E746_A750 (mut) EGFR transfected with GFP-tagged FAN1. Cells were treated with 80 ng/ml MMC for 24 hours. Right panel, Fraction of cells with ≥ 5 foci FAN1. D, Fraction of cells with ≥ 20 γ-H2AX foci in PD20 cells with wt or mut FANCD2 transfected with wt or mut EGFR. Cells were treated with 1 μg/ml MMC for 1 hour and foci scored after 24 hours. All data represent mean ± standard error based on 2-3 biological repeats.

