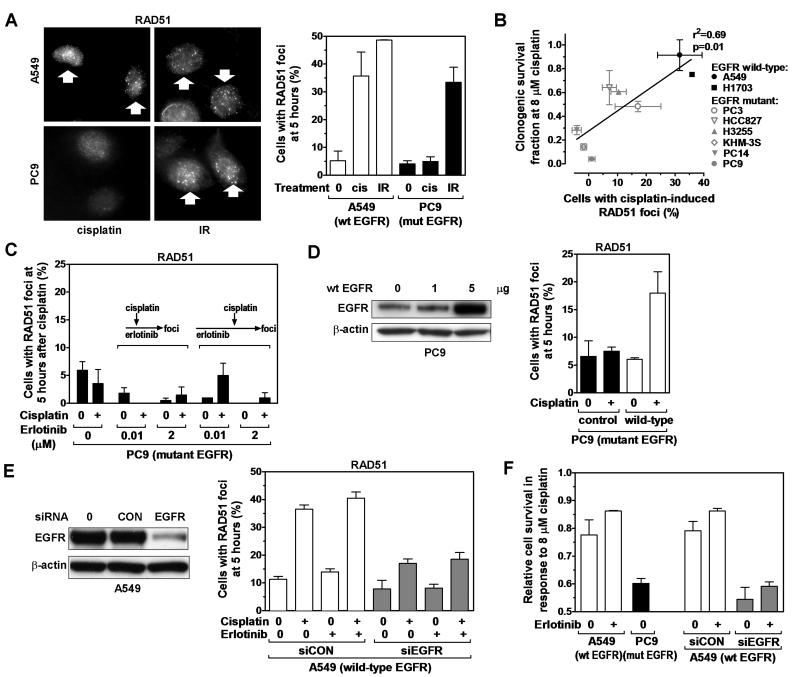
Figure 4.
RAD51 foci formation as a function of EGFR status. A, Left panel, Representative images of nuclei with RAD51 foci induced 5 hours after treatment with cisplatin (cis) (8 μM) or ionizing radiation (IR) (8 Gy). Right panel, Fraction of cells with ≥ 10 RAD51 foci. B, Correlation of clonogenic cisplatin survival with fraction of cells with induced RAD51 foci. Line represents result of linear regression analysis. C, RAD51 foci formation in erlotinib-treated EGFR-mutant PC9 cells. Cells were exposed to erlotinib for 2 hours (illustrated by arrows in the left figure insert) or 19 hours (right insert) prior to adding cisplatin. D, Left panel, Protein levels of EGFR in EGFR-mutant PC9 following transfection of 1 or 5 μg expression vector encoding wild-type (wt) EGFR. Right panel, Fraction of cells with ≥ 10 RAD51 foci 5 hours after cisplatin treatment and 48 hours after transfection with either 5 μg of wild-type EGFR vector or an empty control. Data not corrected for ~50% transfection efficiency (Fig. S1B). E, Left panel, Western blot of A549 cells transfected with scrambled control (CON) siRNA or siRNA against EGFR. Right panel, Fraction of cells with RAD51 foci analogous to panel D. F, Cell survival determined by syto60 staining for the cell lines indicated on the x-axis. All data represent mean ± standard error based on 2-4 biological repeats.

