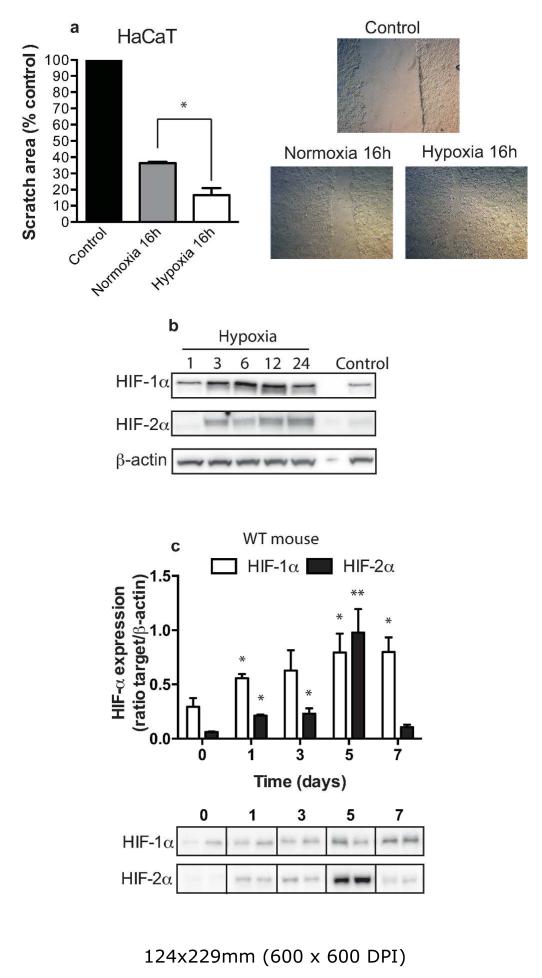
Figure 1. Hypoxia increases the speed of migrating keratinocytes.
HaCaT cells were grown to 85% confluence prior to undertaking a scratch assay under normoxic (21%) and hypoxic (2% oxygen). (a) The scratch area was calculated from a digital image taken initially and 16h post culture. Data shown as the scratch area as a percentage of control (n=8, *p<0.05). Photomicrographs show representative keratinocyte migration speeds. (b) Representative Western blot showing the stability of HIF-1α and HIF-2α in the keratinocyte cell line HaCaT following exposure to hypoxia (2% oxygen). Cells were harvested at 0, 1, 3, 6, 12 and 24h post hypoxia. (c) Wounds from wild-type mice (n=4) were harvested at days 1, 3, 5, 7, lysed and Western blotted for HIF-1α and HIF-2α protein stability. The bar graph shows the ratio of HIF-α against β-actin (au ± SEM) control with a representative Western blot below.

