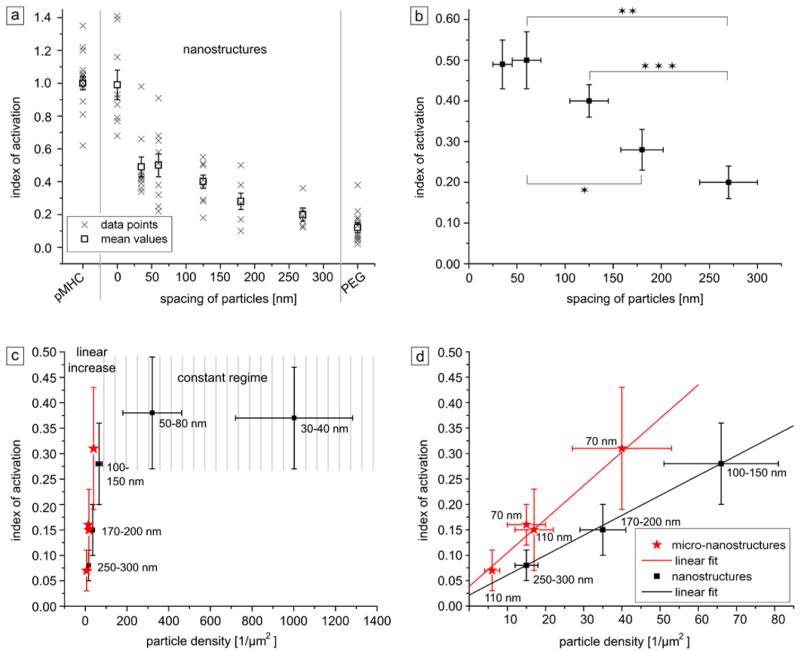
Figure 4.
Index of activation (IL-2 secretion) of T cells seeded on different surfaces plotted against the distance between pMHC-ligands (a and b) or global particle density (c and d). (a) Individual measurements and mean values of the activation rate (Iactivation) as a function of particle spacing. Data obtained using cells seeded on PEG-coated surfaces (negative control, processed identically with the same linker and protein solutions as for the nanopatterned surfaces) is presented on the right side of the graph, whereas data for cells seeded on continuously pMHC-coated surfaces (positive control) are shown on the left side of the graph. Substrates with “0” particle distance (second positive control) were produced using surfaces entirely coated with Au. (b) Representation of mean values only, obtained using the different nanopatterned surfaces (also represented in a). Stars in b indicate significant differences of mean values according to Welch’s t-test: *p = 0.045; **p = 0.012; ****p = 0.005. (c) Mean values of the index of activation of cells cultured on nanopatterned (black data points, see a) and micronanopatterned (red data points, n = 4 for each data point) as a function of global particle density. (d) Selective enlargement of the linear section of plot (c). For each data point in c and d the amount of IL-2 secreted by T cells on the negative control surfaces was set as the background value and subtracted from the IL-2 values measured for each nanopatterned substrate. The y-error bars in all graphs correspond to the standard error of the mean, x-error bars to the standard deviation of the single value. In (c) and (d) Gaussian error propagation was additionally applied to determine deviations of particle densities and background-corrected index of activation (see also error discussion in SI).

