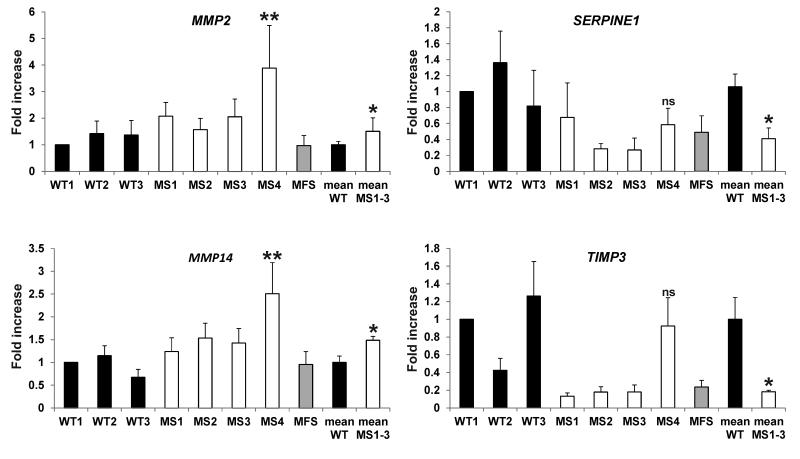
Figure 3.
Altered expression of MMP and relative inhibitors in MS fibroblasts. MS fibroblasts bearing the p.500Ile>Val mutation (MS1, MS2, and MS3) showed increased expression of MMP2 and MMP14 and downregulation of SERPINE1 and TIMP3 compared to healthy controls (WT). MS4 showed significant increase in MMP2 and MMP14 expression, while SERPINE1 and TIMP3 transcripts were in the range of WT controls. MS1-3 represents an average of MS1, MS, and MS3 cells. WT1 and WT mean samples were used as calibrator (t-test: *p<0.05 vs. WT; one sample t-test: **p<0.01 vs. WT).

