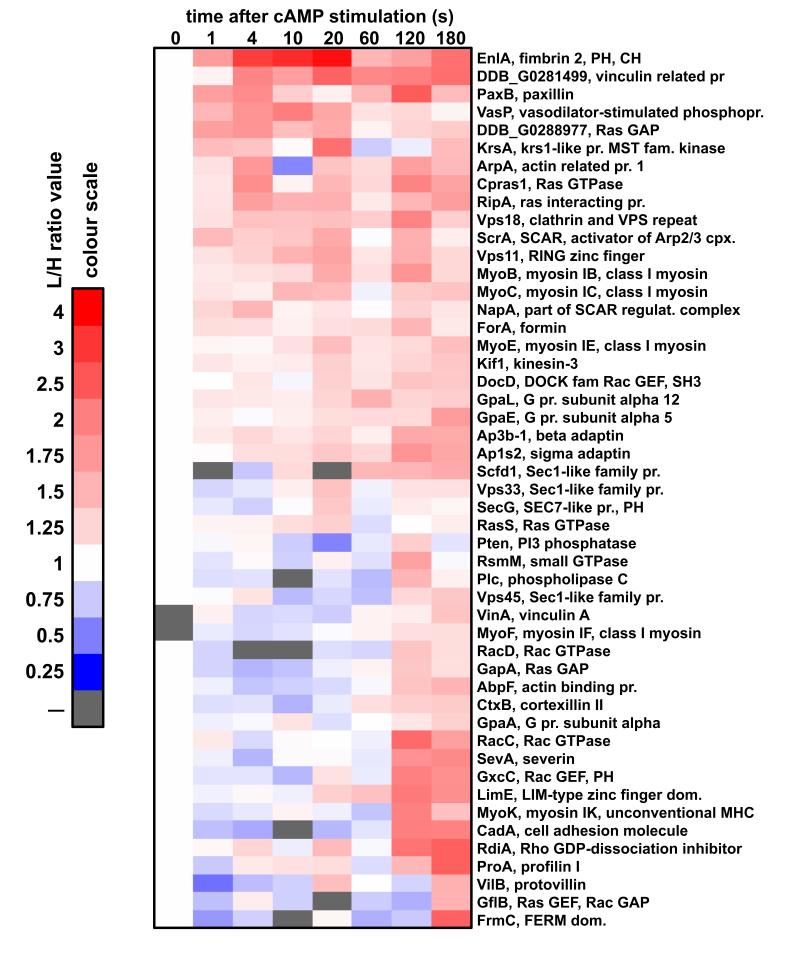
Figure 10. Temporal incorporation profiles for the proteins detected only in the cross-linked SILAC experiment.
Heat-map represents cytoskeleton related proteins which were detected only after formaldehyde cross-linking of the analysed samples and were not detected in the standard SILAC experiments. Heat-map description as before.

