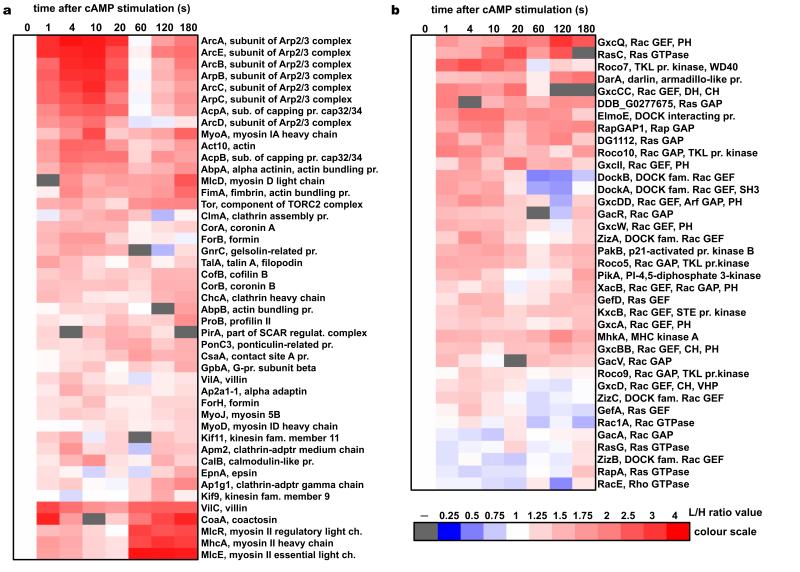
Figure 3. Heat-map representation of the temporal incorporation profiles for the cytoskeletal proteins detected in the SILAC experiments.
(a) Structural and effector proteins of the cytoskeleton. (b) Factors involved in the signalling pathways controlling cytoskeletal dynamics. Heat-maps show proteins that were detected in two biological replica experiments showing positive correlation (R>0.2) between the temporal dynamics detected in each experiment. Columns represent time points after the cAMP stimulation. Red colour indicates increase of protein abundance and blue colour indicates depletion from the cytoskeletal fraction based on the L/H protein ratios normalised to the pre-stimulation value (heat-map colour scale illustrates quantitation). White represents a pre-stimulation level (t0=1) and grey indicates lack of data (protein not detected in any experiment at this time point). On the right side of the heat-maps are given names of the proteins with a brief annotation. It describes protein function (e.g. actin bundling protein), protein class (e.g. RacGEF or TKL protein kinase), name of the protein complex for subunits (e.g. Arp2/3 or myosin II), and names of the major domains of regulatory components (PH – pleckstrin homology; CH – calponin homology; DH – Dbl homology; VHP – villin head-piece; SH3 – SRC homology 3). Protein profiles were clustered with Cluster3 software and heat-maps were generated with Java TreeView software.

